
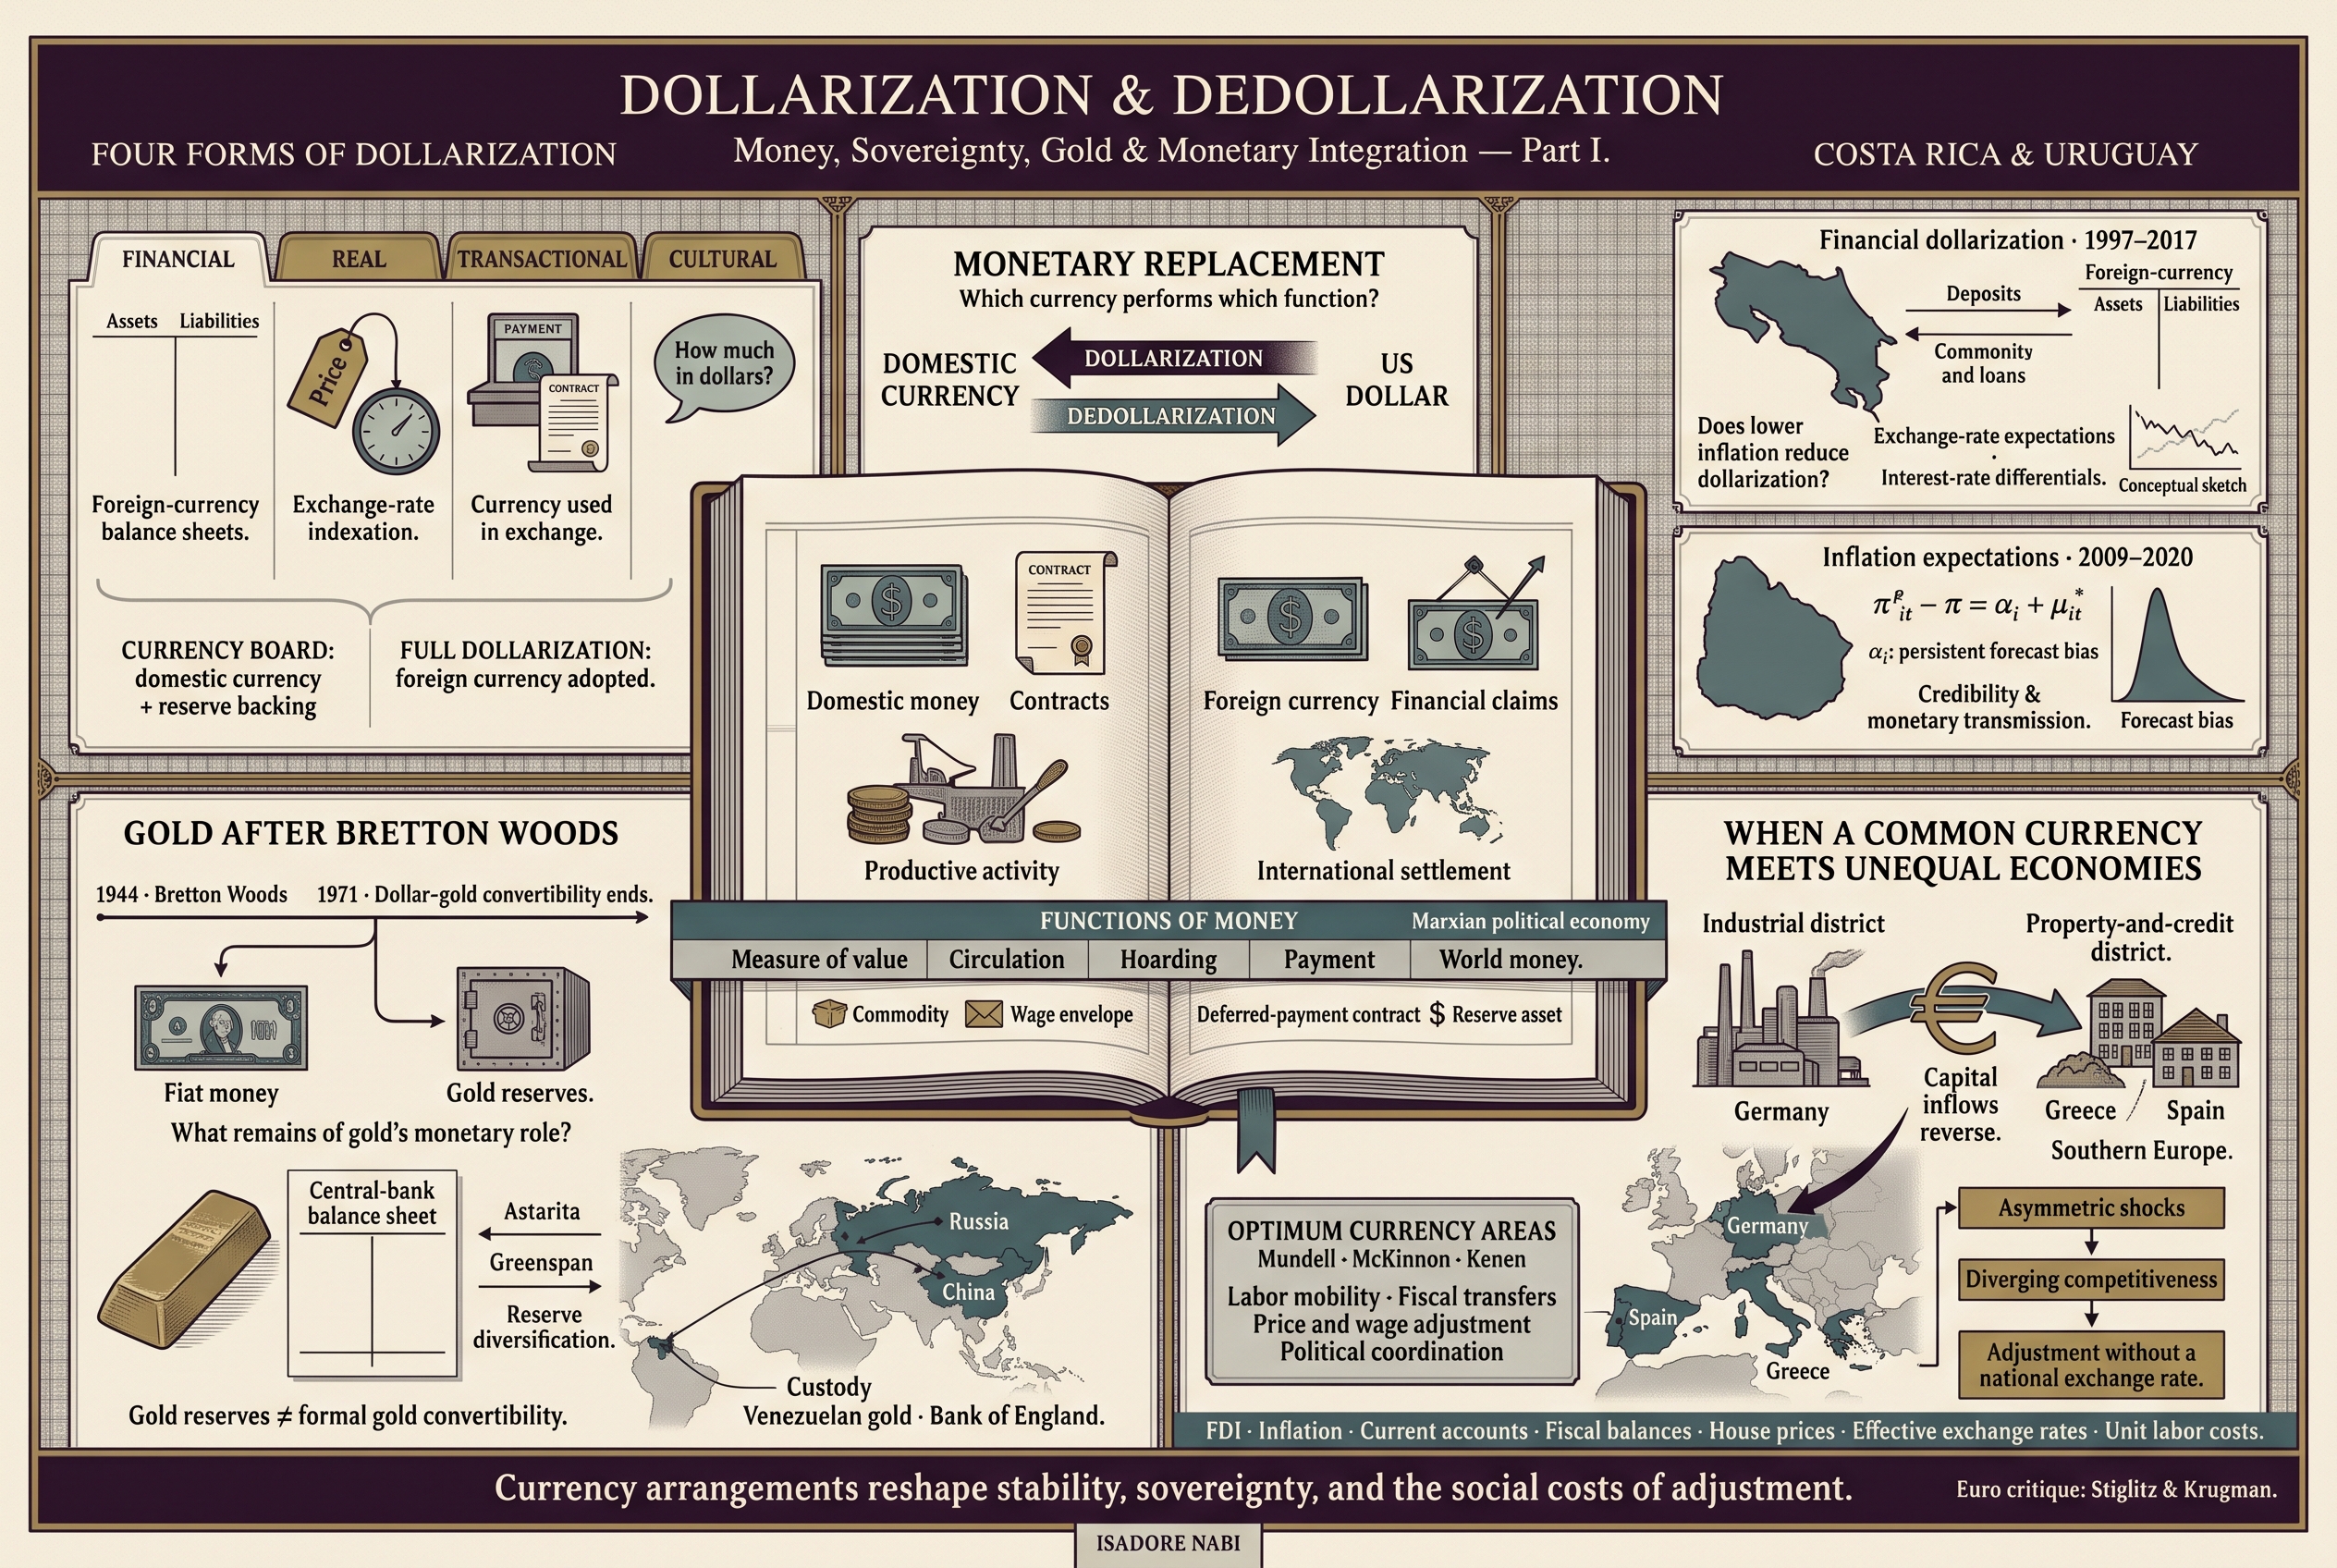
Marxist Philosophy of Science
Political economy · Monetary history · Part II
Dollarization and dedollarization
A Technical, Historical, and International Analysis · Part II
The Oriental Republic of Uruguay: crisis, financial vulnerability, and the rebuilding of peso markets
Originally published: December 2, 2021
Revised: November 4, 2026
I. Structural conditions and monetary crisis
1.1. Overview
As Aboal et al. (2006, p. 8) explain, following the devaluation experienced by Uruguay at the beginning of this century, the government needed to define a monetary anchor that could no longer be the exchange rate. This process took several months and culminated in late 2002 with the adoption of the monetary base as the system’s anchor. As expected, the period following devaluation and the move to a floating exchange rate brought substantial exchange rate volatility. This reflected both the transition from a relatively fixed to a flexible rate and market uncertainty while the future course of monetary policy remained unclear (see Figure 2).
The figures below illustrate these developments. BM denotes the monetary base, and MI denotes the inflation target, retaining the abbreviations used in the Spanish source.
The evolution of de jure monetary and exchange rate policy, 1990–2005
- Exchange rate bands
- Floating exchange rate
- Point target for the monetary base
- Monetary base target range and inflation target
- Inflation targeting?
Note. BM = monetary base; MI = inflation target, using the Spanish abbreviations. The question mark in the final milestone is retained from the published diagram. Adapted from Aboal et al. (2006, p. 8).
Interbank buying exchange rate: daily percentage change, 1999–2005
Note. Approximate vector reconstruction of the published trace; the underlying daily numerical series was not recovered. Annual labels are indicative. The source truncates the largest fluctuations so that the remaining changes remain visible; on some days the change exceeded 10%. Adapted from Aboal et al. (2006, p. 9), using BCU data.
The period after 2002 is the starting point for Labat and Licandro’s (2021) examination of monetary policy, rather than the beginning of dollarization in Uruguay. Dollarization was an earlier, unofficial process whose origins Licandro and Mello (2018, p. 368) trace to the 1950s. It is therefore necessary to distinguish the conditions that produced and consolidated dollarization from the reforms undertaken after the 2002 crisis to reduce its vulnerabilities.
1.2. Inflation
As Labat and Licandro (2021) explain, Uruguay began conducting monetary policy under a freely floating exchange rate only after the 2002 crisis, shifting its nominal objective toward inflation. Uruguay’s history had been marked by successive forms of fixed exchange rate arrangements, interrupted by short and disorderly episodes of floating, until the abandonment of the exchange rate band in June 2002.
During the crisis, the Central Bank chose to manage the monetary base. Its authorities considered it important to commit to an attainable short-term target in order to build credibility over time. From September 2002, the Bank announced quarterly monetary base targets, initially without referring to an inflation target. After the debt exchange was completed in the first half of 2003, the Bank began introducing an explicit numerical reference for inflation.
Policy commitments gradually shifted first toward monetary aggregates and then toward inflation. By early 2005, Uruguay operated under what could be described as an inflation targeting regime, using monetary aggregates as the policy instrument. The Ministry of Economy and Finance initially set the midpoint of the target range at 5.5%; this was reduced to 5% in early 2005 and remained there until August 2020. The band was initially set at ±2 percentage points, temporarily narrowed to ±1 percentage point in 2009, and restored to its earlier design in 2013.
The initial monetary policy instrument under inflation targeting was M1′. In July 2007, the Banco Central del Uruguay switched to the overnight interbank interest rate, before returning to monetary aggregate management in July 2013.
According to Labat and Licandro’s (2021) assessment, the Central Bank’s new charter was approved in 2008. Although the law gave the financial services regulator greater autonomy, its initial intention to improve the monetary policy framework was not fulfilled. The draft sent by the Central Bank to the Ministry of Economy and Finance was aligned with established principles of central bank institutional design and proposed several improvements that were absent from the final text. These included prioritizing inflation as the principal objective, introducing overlapping eight-year terms for board members, and strengthening accountability. Such proposals failed during the parliamentary process, as similar initiatives had in the 1995 discussions.
None of these proposals was ultimately adopted. Instead, the creation of a Macroeconomic Coordination Committee (CCM), with an ambiguous mandate and a clear predominance of the Ministry of Economy and Finance over the Central Bank, reduced the latter’s independence; see Licandro and Licandro (2010, as cited in Labat & Licandro, 2021). The new charter also described the Bank’s objectives ambiguously, leaving considerable room for different interpretations of how policy should be conducted.
In Labat and Licandro’s (2021) interpretation, monetary policy practice did not remedy the institutional design. The Central Bank maintained close institutional coordination with the Ministry of Economy and Finance. After the CCM was established, its quarterly meetings were held the day before, or even on the same day as, Monetary Policy Committee meetings, immediately before the COPOM sessions. This remained the usual coordination practice until early 2020. The authors also characterize the period as one of persistent and visible conflict among the Central Bank’s objectives.
The Central Bank highlighted this conflict in its public communication through images presenting monetary policy as a balancing exercise, an imperfect discipline, and an activity requiring flexibility in the use of instruments. This reflected an interpretation of its statutory mandate in which the conflict between economic activity and inflation was permanent. In practice, inflation became the priority when it approached 10%, while activity took precedence when inflation approached its target.
Alegre (2008, p. 148) describes the evolution of inflation and real wages as follows (English translation):
As inflation declined progressively to single digits by the late 1990s—from 81% in 1991 to slightly above 8% in 1998—real wages increased much more moderately over the same period, by approximately 7.5% cumulatively between 1991 and 1998 (INE, 2003).
The reference to the INE’s 2003 data appears within Alegre’s discussion and is therefore used here as an indirect citation.
1.3. External debt
Alegre (2008, p. 148) describes the implications of the Brady Plan as follows (English translation):
The refinancing of Uruguay’s external debt through the Brady Plan involved debt reductions for Uruguay and other participating countries in the region, in exchange for commitments to accelerate reforms in areas such as public enterprises, trade, and the labor market. The renegotiation also redirected exchange rate policy away from achieving external balance and toward an anti-inflationary role, since maintaining a high exchange rate to generate trade surpluses for debt payments was no longer necessary (Rodríguez, Cozzano, & Mazzuchi, 2001).
Rodríguez et al. (2001) are cited within Alegre’s passage and are used here through that secondary source.
To reconstruct the external debt background, the research conducted on June 7, 2021 used a copy of the Banco Central del Uruguay report preserved by the Internet Archive, because of the access difficulties encountered at the time. Within the initial period of interest, 1990–2003, the recovered material covers 1999–2003. The reproduced report also contains subsequent annual figures and quarterly observations through December 2015, all of which are retained in the tables below. Difficulties encountered in that consultation do not imply that institutional portals currently lack relevant data.
| Period | Total | Central government | Local governments | Public enterprises | BCU | Public banks | Private banks | Private nonbank sector |
|---|---|---|---|---|---|---|---|---|
| 1999 | 13,382 | 4,120 | 83 | 530 | 858 | 378 | 7,413 | N/A |
| 2000 | 14,607 | 4,697 | 105 | 499 | 791 | 346 | 8,169 | N/A |
| 2001 | 15,967 | 4,586 | 128 | 494 | 621 | 681 | 9,458 | N/A |
| 2002 | 12,876 | 7,161 | 136 | 440 | 562 | 340 | 4,237 | N/A |
| 2003 | 13,241 | 8,200 | 147 | 440 | 770 | 343 | 3,340 | N/A |
| 2004 | 14,082 | 8,628 | 151 | 392 | 1,035 | 317 | 3,559 | N/A |
| 2005 | 13,717 | 8,767 | 150 | 417 | 842 | 322 | 3,218 | N/A |
| 2006 | 12,977 | 8,582 | 148 | 532 | 50 | 326 | 3,340 | N/A |
| 2007 | 14,864 | 9,928 | 138 | 895 | 105 | 318 | 3,480 | N/A |
| 2008 | 15,425 | 9,533 | 128 | 919 | 155 | 329 | 4,361 | N/A |
| 2009 | 17,969 | 10,640 | 118 | 1,392 | 619 | 348 | 4,853 | N/A |
| 2010 | 18,425 | 10,593 | 108 | 1,283 | 838 | 361 | 5,243 | N/A |
| 2011 | 18,345 | 11,319 | 141 | 1,784 | 814 | 379 | 3,909 | N/A |
| I.12 | 20,959 | 11,762 | 145 | 1,837 | 753 | 396 | 3,779 | 2,287 |
| II.12 | 21,312 | 11,337 | 145 | 1,990 | 993 | 393 | 3,919 | 2,534 |
| III.12 | 22,230 | 11,581 | 153 | 1,995 | 1,237 | 420 | 4,081 | 2,762 |
| 2012 | 24,030 | 12,902 | 157 | 1,939 | 1,248 | 417 | 4,324 | 3,044 |
| I.13 | 23,568 | 12,956 | 159 | 1,270 | 1,211 | 431 | 4,367 | 3,174 |
| II.13 | 24,516 | 13,127 | 168 | 1,301 | 1,386 | 459 | 4,648 | 3,427 |
| III.13 | 25,795 | 13,839 | 168 | 1,433 | 1,568 | 465 | 4,718 | 3,605 |
| 2013 | 26,518 | 14,255 | 173 | 1,546 | 1,586 | 485 | 4,640 | 3,833 |
| I.14 | 26,686 | 13,796 | 172 | 1,707 | 1,713 | 515 | 4,636 | 4,147 |
| II.14 | 28,553 | 15,010 | 166 | 1,736 | 1,744 | 515 | 4,869 | 4,514 |
| III.14 | 28,405 | 14,756 | 165 | 1,687 | 1,596 | 528 | 4,898 | 4,775 |
| 2014 | 28,100 | 14,904 | 171 | 1,817 | 1,513 | 545 | 4,961 | 4,188 |
| I.15 * | 29,513 | 15,775 | 171 | 1,877 | 1,402 | 757 | 5,322 | 4,209 |
| II.15 * | 29,464 | 15,467 | 164 | 1,973 | 1,555 | 773 | 5,204 | 4,327 |
| III.15 * | 28,105 | 14,976 | 164 | 1,411 | 1,178 | 815 | 5,202 | 4,359 |
| 2015 * | 28,678 | 15,491 | 158 | 1,373 | 1,043 | 873 | 5,164 | 4,576 |
Percentages calculated from the balances in Table 1. These replace the pie chart and may differ from its whole-number percentages because of rounding.
| Period | Total | Debt securities | Brady bonds | International loans | Trade credits | Deposits | Other |
|---|---|---|---|---|---|---|---|
| 1999 | 13,382 | 2,398 | 644 | 2,496 | 493 | 6,633 | 718 |
| 2000 | 14,607 | 2,848 | 593 | 2,603 | 474 | 7,237 | 853 |
| 2001 | 15,967 | 2,719 | 431 | 2,625 | 478 | 8,760 | 953 |
| 2002 | 12,876 | 2,955 | 410 | 4,881 | 483 | 3,489 | 658 |
| 2003 | 13,241 | 3,567 | 156 | 5,709 | 554 | 2,818 | 437 |
| 2004 | 14,082 | 3,976 | 143 | 5,950 | 563 | 3,018 | 432 |
| 2005 | 13,717 | 4,383 | 26 | 5,564 | 625 | 2,686 | 433 |
| 2006 | 12,977 | 6,306 | 3 | 2,717 | 705 | 2,814 | 432 |
| 2007 | 14,864 | 7,702 | 0 | 2,722 | 1,059 | 2,949 | 433 |
| 2008 | 15,425 | 6,980 | 0 | 3,271 | 898 | 3,845 | 431 |
| 2009 | 17,969 | 7,188 | 0 | 4,717 | 1,270 | 4,361 | 433 |
| 2010 | 18,425 | 7,802 | 0 | 4,138 | 1,286 | 4,415 | 784 |
| 2011 | 18,345 | 8,813 | 0 | 4,176 | 1,471 | 3,881 | 4 |
| I.12 | 20,959 | 9,336 | 0 | 6,675 | 1,257 | 3,569 | 122 |
| II.12 | 21,312 | 9,190 | 0 | 7,027 | 1,363 | 3,610 | 121 |
| III.12 | 22,230 | 9,685 | 0 | 7,366 | 1,259 | 3,796 | 124 |
| 2012 | 24,030 | 11,056 | 0 | 7,763 | 1,194 | 3,890 | 127 |
| I.13 | 23,568 | 11,628 | 0 | 7,446 | 527 | 3,853 | 114 |
| II.13 | 24,516 | 11,986 | 0 | 7,846 | 515 | 4,069 | 100 |
| III.13 | 25,795 | 12,880 | 0 | 8,016 | 639 | 4,173 | 88 |
| 2013 | 26,518 | 13,280 | 0 | 8,381 | 581 | 4,202 | 74 |
| I.14 | 26,686 | 12,916 | 0 | 8,633 | 784 | 4,232 | 122 |
| II.14 | 28,553 | 14,142 | 0 | 8,931 | 870 | 4,479 | 130 |
| III.14 | 28,405 | 13,782 | 0 | 9,270 | 714 | 4,431 | 208 |
| 2014 | 28,100 | 13,866 | 0 | 8,709 | 865 | 4,428 | 232 |
| I.15 * | 29,513 | 14,695 | 0 | 9,158 | 850 | 4,564 | 247 |
| II.15 * | 29,464 | 14,508 | 0 | 9,173 | 959 | 4,566 | 257 |
| III.15 * | 28,105 | 13,645 | 0 | 9,094 | 367 | 4,728 | 270 |
| 2015 * | 28,678 | 13,996 | 0 | 9,202 | 461 | 4,741 | 278 |
Percentages calculated from the balances in Table 2, replacing the source’s pie chart.
| Period | Total | Up to one year | Over one year | Pesos | US dollars | Yen | Euros | SDRs | Other |
|---|---|---|---|---|---|---|---|---|---|
| 1999 | 13,382 | 7,388 | 5,994 | 6 | 12,606 | 144 | 7 | 157 | 462 |
| 2000 | 14,607 | 8,099 | 6,508 | 5 | 13,713 | 133 | 176 | 149 | 431 |
| 2001 | 15,967 | 9,729 | 6,238 | 7 | 14,932 | 324 | 345 | 143 | 216 |
| 2002 | 12,876 | 3,651 | 9,225 | 2 | 10,267 | 294 | 462 | 1,794 | 57 |
| 2003 | 13,241 | 2,966 | 10,275 | 210 | 9,864 | 251 | 435 | 2,416 | 64 |
| 2004 | 14,082 | 3,371 | 10,711 | 447 | 10,133 | 262 | 474 | 2,683 | 81 |
| 2005 | 13,717 | 3,036 | 10,681 | 405 | 10,046 | 229 | 665 | 2,311 | 63 |
| 2006 | 12,977 | 3,157 | 9,820 | 542 | 11,531 | 221 | 626 | 7 | 51 |
| 2007 | 14,864 | 3,553 | 11,310 | 1,774 | 11,943 | 472 | 632 | 8 | 35 |
| 2008 | 15,425 | 4,221 | 11,204 | 1,517 | 12,829 | 556 | 488 | 7 | 28 |
| 2009 | 17,969 | 4,996 | 12,973 | 1,225 | 15,211 | 538 | 497 | 465 | 33 |
| 2010 | 18,425 | 5,177 | 13,248 | 1,781 | 15,168 | 544 | 455 | 458 | 19 |
| 2011 | 18,345 | 4,071 | 14,274 | 3,202 | 13,993 | 528 | 146 | 456 | 20 |
| I.12 | 20,959 | 5,049 | 15,909 | 3,745 | 16,091 | 491 | 149 | 461 | 20 |
| II.12 | 21,312 | 5,299 | 16,012 | 3,604 | 16,561 | 507 | 169 | 451 | 19 |
| III.12 | 22,230 | 5,421 | 16,809 | 4,158 | 16,921 | 519 | 153 | 459 | 20 |
| 2012 | 24,030 | 5,562 | 18,468 | 5,458 | 17,498 | 470 | 128 | 457 | 20 |
| I.13 | 23,568 | 5,620 | 17,948 | 6,284 | 16,266 | 428 | 126 | 444 | 20 |
| II.13 | 24,516 | 5,895 | 18,621 | 6,664 | 16,863 | 406 | 116 | 447 | 19 |
| III.13 | 25,795 | 5,873 | 19,922 | 6,443 | 18,368 | 410 | 100 | 455 | 19 |
| 2013 | 26,518 | 5,815 | 20,703 | 7,020 | 18,529 | 383 | 110 | 457 | 19 |
| I.14 | 26,686 | 6,009 | 20,677 | 6,645 | 19,068 | 389 | 106 | 458 | 20 |
| II.14 | 28,553 | 6,293 | 22,260 | 6,774 | 20,805 | 396 | 99 | 458 | 20 |
| III.14 | 28,405 | 6,379 | 22,026 | 6,413 | 21,075 | 366 | 94 | 439 | 19 |
| 2014 | 28,100 | 6,347 | 21,753 | 6,545 | 20,348 | 586 | 174 | 429 | 18 |
| I.15 * | 29,513 | 6,473 | 23,040 | 6,430 | 21,921 | 584 | 154 | 408 | 16 |
| II.15 * | 29,464 | 6,399 | 23,064 | 6,284 | 22,016 | 572 | 160 | 416 | 16 |
| III.15 * | 28,105 | 6,391 | 21,714 | 5,534 | 21,388 | 584 | 171 | 415 | 14 |
| 2015 * | 28,678 | 6,318 | 22,360 | 5,079 | 22,431 | 580 | 164 | 410 | 13 |
Percentages calculated from Table 3.
Percentages calculated from Table 3. External debt is defined by the creditor’s residence and may therefore include liabilities denominated in pesos.
| Period | Total assets | NFPS · short | NFPS · long | BCU · short | BCU · long | Public banks · short | Public banks · long |
|---|---|---|---|---|---|---|---|
| 1999 | -10,502 | 0 | -62 | -2,606 | -255 | -648 | -43 |
| 2000 | -11,237 | 0 | -95 | -2,742 | -258 | -561 | -67 |
| 2001 | -12,898 | 0 | -85 | -3,099 | -263 | -638 | -70 |
| 2002 | -5,682 | -505 | -127 | -777 | -282 | -296 | -20 |
| 2003 | -6,932 | -230 | -184 | -2,088 | -256 | -866 | -58 |
| 2004 | -7,877 | -20 | -103 | -2,514 | -332 | -1,154 | -328 |
| 2005 | -8,956 | -52 | -148 | -3,398 | -288 | -1,384 | -313 |
| 2006 | -8,815 | -67 | -151 | -3,091 | -291 | -1,094 | -810 |
| 2007 | -11,239 | -251 | -231 | -5,016 | -273 | -1,839 | -402 |
| 2008 | -13,233 | -94 | -183 | -6,659 | -548 | -1,611 | -295 |
| 2009 | -16,630 | -245 | -283 | -8,210 | -609 | -1,307 | -1,082 |
| 2010 | -18,270 | -144 | -29 | -7,940 | -622 | -2,134 | -1,441 |
| 2011 | -19,568 | -76 | -4 | -10,314 | -752 | -1,491 | -2,391 |
| I.12 | -31,254 | -136 | -27 | -11,296 | -708 | -2,915 | -969 |
| II.12 | -32,568 | -107 | -5 | -12,101 | -705 | -2,979 | -967 |
| III.12 | -31,945 | -69 | -22 | -12,817 | -733 | -2,999 | -980 |
| 2012 | -31,879 | -64 | -28 | -13,567 | -731 | -2,752 | -1,127 |
| I.13 | -32,521 | -100 | -16 | -13,478 | -733 | -2,779 | -1,142 |
| II.13 | -34,409 | -112 | -24 | -14,863 | -729 | -2,952 | -1,120 |
| III.13 | -35,830 | -11 | -32 | -15,861 | -760 | -3,022 | -1,167 |
| 2013 | -35,565 | -93 | -26 | -16,275 | -765 | -2,923 | -1,180 |
| I.14 | -36,472 | -101 | -38 | -16,504 | -785 | -2,748 | -1,262 |
| II.14 | -38,291 | -174 | -26 | -18,603 | -796 | -2,828 | -1,330 |
| III.14 | -39,318 | -115 | -27 | -17,757 | -831 | -2,979 | -1,521 |
| 2014 | -37,420 | -42 | -40 | -17,555 | -818 | -2,750 | -1,561 |
| I.15 * | -39,599 | -65 | -33 | -18,584 | -816 | -2,843 | -1,536 |
| II.15 * | -39,962 | -95 | -44 | -18,324 | -820 | -3,050 | -1,572 |
| III.15 * | -38,018 | -54 | -39 | -16,424 | -855 | -3,348 | -1,901 |
| 2015 * | -37,923 | -49 | -40 | -15,634 | -861 | -3,257 | -2,023 |
| Period | Banks · short | Banks · long | Nonbanks · short | Nonbanks · long |
|---|---|---|---|---|
| 1999 | -3,928 | -2,960 | N/A | N/A |
| 2000 | -4,809 | -2,705 | N/A | N/A |
| 2001 | -4,551 | -4,192 | N/A | N/A |
| 2002 | -2,419 | -1,256 | N/A | N/A |
| 2003 | -1,682 | -1,568 | N/A | N/A |
| 2004 | -2,086 | -1,340 | N/A | N/A |
| 2005 | -2,375 | -997 | N/A | N/A |
| 2006 | -2,336 | -974 | N/A | N/A |
| 2007 | -2,231 | -996 | N/A | N/A |
| 2008 | -2,790 | -1,053 | N/A | N/A |
| 2009 | -3,804 | -1,091 | N/A | N/A |
| 2010 | -4,543 | -1,417 | N/A | N/A |
| 2011 | -3,782 | -757 | N/A | N/A |
| I.12 | -4,212 | -975 | -8,287 | -1,728 |
| II.12 | -4,031 | -965 | -8,979 | -1,728 |
| III.12 | -3,687 | -1,140 | -7,774 | -1,726 |
| 2012 | -3,365 | -1,200 | -7,629 | -1,416 |
| I.13 | -3,732 | -1,127 | -7,996 | -1,418 |
| II.13 | -3,517 | -1,214 | -8,461 | -1,418 |
| III.13 | -4,032 | -1,067 | -8,464 | -1,415 |
| 2013 | -3,128 | -990 | -8,729 | -1,456 |
| I.14 | -3,417 | -999 | -9,163 | -1,455 |
| II.14 | -3,159 | -823 | -9,095 | -1,457 |
| III.14 | -4,199 | -799 | -9,634 | -1,456 |
| 2014 | -3,603 | -782 | -8,764 | -1,507 |
| I.15 * | -4,406 | -807 | -9,319 | -1,190 |
| II.15 * | -4,552 | -862 | -9,614 | -1,029 |
| III.15 * | -4,581 | -892 | -9,048 | -876 |
| 2015 * | -4,236 | -1,465 | -9,378 | -979 |
| Period | National total | Public · total | Public · short · net | Public · short · gross | Public · short · assets | Public · long · net | Public · long · gross | Public · long · assets |
|---|---|---|---|---|---|---|---|---|
| 1999 | 2,880 | 2,668 | -2,070 | 536 | -2,606 | 4,738 | 5,055 | -317 |
| 2000 | 3,370 | 2,997 | -2,117 | 625 | -2,742 | 5,114 | 5,467 | -353 |
| 2001 | 3,069 | 2,381 | -2,528 | 571 | -3,099 | 4,909 | 5,257 | -348 |
| 2002 | 7,194 | 6,608 | -404 | 878 | -1,282 | 7,013 | 7,421 | -409 |
| 2003 | 6,309 | 6,800 | -1,338 | 980 | -2,318 | 8,138 | 8,577 | -440 |
| 2004 | 6,205 | 7,237 | -1,309 | 1,225 | -2,534 | 8,546 | 8,981 | -435 |
| 2005 | 4,761 | 6,290 | -1,494 | 1,957 | -3,450 | 7,783 | 8,220 | -437 |
| 2006 | 4,162 | 5,711 | -2,819 | 339 | -3,158 | 8,529 | 8,972 | -443 |
| 2007 | 3,625 | 5,295 | -4,620 | 646 | -5,266 | 9,915 | 10,419 | -504 |
| 2008 | 2,192 | 3,252 | -6,243 | 509 | -6,752 | 9,495 | 10,226 | -732 |
| 2009 | 1,340 | 3,424 | -7,589 | 866 | -8,455 | 11,012 | 11,904 | -892 |
| 2010 | 176 | 4,107 | -6,835 | 1,249 | -8,084 | 10,942 | 11,593 | -651 |
| 2011 | -1,221 | 2,912 | -9,291 | 1,099 | -10,390 | 12,203 | 12,960 | -757 |
| I.12 | -10,295 | 2,329 | -10,293 | 1,138 | -11,431 | 12,622 | 13,358 | -736 |
| II.12 | -11,256 | 1,548 | -11,461 | 747 | -12,208 | 13,008 | 13,718 | -710 |
| III.12 | -9,713 | 1,329 | -10,826 | 2,060 | -12,885 | 12,155 | 12,909 | -755 |
| 2012 | -7,848 | 1,857 | -11,567 | 2,064 | -13,631 | 13,424 | 14,182 | -759 |
| I.13 | -8,951 | 1,270 | -11,897 | 1,681 | -13,578 | 13,168 | 13,917 | -749 |
| II.13 | -9,894 | 254 | -13,205 | 1,770 | -14,975 | 13,459 | 14,212 | -752 |
| III.13 | -10,034 | 345 | -14,231 | 1,641 | -15,872 | 14,576 | 15,367 | -791 |
| 2013 | -9,047 | 400 | -14,807 | 1,562 | -16,368 | 15,207 | 15,997 | -791 |
| I.14 | -9,785 | -40 | -14,734 | 1,871 | -16,605 | 14,694 | 15,517 | -823 |
| II.14 | -9,737 | -944 | -16,888 | 1,890 | -18,777 | 15,944 | 16,766 | -822 |
| III.14 | -10,913 | -527 | -15,910 | 1,962 | -17,872 | 15,384 | 16,242 | -858 |
| 2014 | -9,321 | -48 | -14,632 | 2,964 | -17,596 | 14,585 | 15,442 | -857 |
| I.15 * | -10,086 | -274 | -15,721 | 2,927 | -18,649 | 15,448 | 16,297 | -849 |
| II.15 * | -10,498 | -123 | -15,579 | 2,840 | -18,418 | 15,455 | 16,320 | -864 |
| III.15 * | -9,913 | 357 | -14,545 | 1,934 | -16,479 | 14,901 | 15,795 | -894 |
| 2015 * | -9,245 | 1,480 | -14,332 | 1,352 | -15,684 | 15,812 | 16,713 | -902 |
| Period | Private · total | Short · net | Short · gross | Short · assets | Long · net | Long · gross | Long · assets |
|---|---|---|---|---|---|---|---|
| 1999 | 212 | 3,153 | 7,728 | -4,576 | -2,940 | 63 | -3,003 |
| 2000 | 373 | 3,104 | 8,475 | -5,371 | -2,731 | 41 | -2,771 |
| 2001 | 687 | 4,906 | 10,096 | -5,190 | -4,219 | 43 | -4,262 |
| 2002 | 586 | 1,823 | 4,538 | -2,715 | -1,237 | 39 | -1,276 |
| 2003 | -491 | 1,103 | 3,651 | -2,548 | -1,594 | 33 | -1,626 |
| 2004 | -1,033 | -386 | 2,854 | -3,241 | -646 | 1,021 | -1,668 |
| 2005 | -1,528 | -1,181 | 2,578 | -3,759 | -347 | 963 | -1,310 |
| 2006 | -1,549 | -724 | 2,707 | -3,430 | -825 | 959 | -1,784 |
| 2007 | -1,670 | -1,196 | 2,874 | -4,070 | -474 | 924 | -1,399 |
| 2008 | -1,059 | -708 | 3,692 | -4,401 | -351 | 997 | -1,348 |
| 2009 | -2,083 | -925 | 4,185 | -5,110 | -1,158 | 1,015 | -2,173 |
| 2010 | -3,931 | -2,417 | 4,259 | -6,676 | -1,513 | 1,345 | -2,858 |
| 2011 | -4,133 | -1,526 | 3,747 | -5,273 | -2,607 | 542 | -3,148 |
| I.12 | -12,625 | -11,162 | 4,252 | -15,415 | -1,462 | 2,210 | -3,672 |
| II.12 | -12,804 | -11,661 | 4,329 | -15,990 | -1,143 | 2,518 | -3,660 |
| III.12 | -11,042 | -9,971 | 4,488 | -14,459 | -1,071 | 2,775 | -3,846 |
| 2012 | -9,704 | -9,034 | 4,712 | -13,746 | -670 | 3,073 | -3,743 |
| I.13 | -10,222 | -9,749 | 4,758 | -14,507 | -473 | 3,213 | -3,686 |
| II.13 | -10,148 | -9,927 | 5,002 | -14,929 | -221 | 3,531 | -3,752 |
| III.13 | -10,379 | -10,454 | 5,063 | -15,517 | 75 | 3,724 | -3,649 |
| 2013 | -9,447 | -9,826 | 4,954 | -14,780 | 379 | 4,005 | -3,626 |
| I.14 | -9,745 | -10,290 | 5,038 | -15,328 | 545 | 4,260 | -3,716 |
| II.14 | -8,794 | -9,795 | 5,286 | -15,082 | 1,001 | 4,611 | -3,610 |
| III.14 | -10,387 | -11,437 | 5,374 | -16,811 | 1,051 | 4,828 | -3,777 |
| 2014 | -9,273 | -9,666 | 5,451 | -15,117 | 393 | 4,243 | -3,850 |
| I.15 * | -9,812 | -10,720 | 5,848 | -16,567 | 907 | 4,441 | -3,533 |
| II.15 * | -10,375 | -11,468 | 5,747 | -17,215 | 1,093 | 4,557 | -3,464 |
| III.15 * | -10,270 | -11,098 | 5,879 | -16,978 | 829 | 4,497 | -3,668 |
| 2015 * | -10,725 | -10,967 | 5,904 | -16,871 | 242 | 4,709 | -4,467 |
1.4. Exchange rate
According to Alegre (2008, pp. 147–149), Uruguay in the 1990s combined an exchange rate anchor with fiscal imbalances sensitive to economic and electoral cycles, and with a financial market vulnerable to international shocks. The Banco Central del Uruguay managed a fluctuation band for the peso against the dollar, buying and selling foreign currency to maintain its limits. An exchange rate band is not identical to every form of managed floating: in this case, explicit boundaries constrained exchange rate movements.
Alegre (2008, p. 148) links overvaluation and import growth as follows (English translation):
(…) relief from external indebtedness and access to low-interest credit under an overvalued exchange rate created incentives for imports of final consumption goods, generating import booms that were not matched by increases in economic productivity. This combination created serious difficulties once conditions changed. Regional devaluations weakened our country’s competitiveness.
Alegre (2008, p. 149) explains that weaker international demand, the loss of export markets, and falling commodity prices contributed to large capital outflows. Higher interest rates increased the cost of credit, while exchange rate overvaluation and persistent borrowing undermined the system’s sustainability. The crisis culminated in the abandonment of the exchange rate band in 2002. Reserve losses and the need to support bank deposits intensified pressure on public finances and increased reliance on international financing.
The estimate of reserves at approximately one billion dollars in late June 2002 comes from the BCU’s 2002 figures, cited indirectly by Alegre (2008, p. 149).
II. The historical evolution of dollarization in Uruguay
In 2021, dedollarization regained prominence in Uruguay’s economic policy debate. El País (2021) reported on the proposal promoted by Diego Labat, then president of the Banco Central del Uruguay, and Gerardo Licandro. Their document Hacia una moneda de calidad [Toward a quality currency] sets out an agenda for stabilization, rebuilding peso markets, and reducing dollarization (Labat & Licandro, 2021).
Labat and Licandro (2021) argue that a quality currency supports growth, financial stability, and less pronounced economic cycles, and can mitigate certain distributional effects of inflation. Their approach, situated within the neoclassical macroeconomic tradition, draws on research connecting inflation, growth, and financial development: Barro (1995), Sarel (1995), Khan and Senhadji (2001), and Ibarra and Trupkin (2016), all cited in Labat and Licandro (2021). The reference to a threshold near 8% reflects the empirical result of Ibarra and Trupkin discussed by the authors; it is not a universal law applicable to every country, period, and institutional regime.
Labat and Licandro (2021) propose that chronic inflation erodes financial markets denominated in domestic currency and encourages indexation mechanisms, including dollar denomination. In their account, Rousseau and Wachtel (2002, as cited in Labat & Licandro, 2021) connect financial depth with growth and show that high inflation can weaken that connection. Financial dollarization—the currency denomination of assets and liabilities—should be distinguished from real or price dollarization—the currency used for invoicing and price setting—even though the two interact.
High inflation combined with external macroeconomic shocks, in a setting where the domestic currency’s role is progressively shrinking, considerably increases the risk of structural financial failure. Such shocks are common in small, highly open economies such as Uruguay. This configuration made dollarization a critical concern for Uruguay’s monetary authorities and other public institutions (Labat & Licandro, 2021).
Labat and Licandro (2021) describe a balance sheet vulnerability mechanism: an adverse external shock may raise the real value of the dollar while reducing activity, employment, and real incomes. When a firm or household receives peso income but owes dollar debt, depreciation increases debt service expressed in domestic currency. This can occur even without an increase in the contractual dollar interest rate. Adequate peso financing provides an alternative for reducing that mismatch. When many borrowers are affected, default risk increases and can spread to the financial system and public finances.
This is a systemic risk conditioned by balance sheets, hedging arrangements, and institutional responses, rather than an inevitable generalized default.
According to Labat and Licandro (2021), the shortage of peso financing induces corporate responses that affect both balance sheets and production and marketing decisions. Licandro et al. (2014, as cited in Labat & Licandro, 2021) document lower leverage, faster inventory turnover, input accumulation, and liquidity holdings as substitutes for derivative-based hedging. Mello (2017), Licandro and Mello (2017), and Barón et al. (2017), cited in Labat and Licandro (2021), analyze liquidity accumulation and dollar invoicing as exchange rate hedging strategies used by Uruguayan firms.
Dollar-denominated prices can deepen real economic cycles because dollar price rigidities shift a greater adjustment burden onto quantities than domestic currency price rigidities. With rigid prices, a negative demand shock affects quantities more strongly than when prices are flexible. Dollar price rigidity can be particularly damaging: when an adverse shock raises the dollar’s value, as in Uruguay, the peso price of the good rises rather than remaining unchanged, as it would under peso price rigidity, producing a steeper decline in output.
Uruguay’s housing sector provides an example: it responds negatively to shocks that raise the real value of the dollar, in contrast with countries such as Colombia and Chile, where property prices are not conventionally quoted in dollars (Labat & Licandro, 2021).
Labat and Licandro (2021) also examine distributional effects. When a mortgage has a fixed nominal balance in domestic currency, higher inflation reduces the real value of that balance; the household’s outcome also depends on its income, assets, and interest rate adjustments. This mechanism does not carry over unchanged to indexed or dollar-denominated debt. The authors draw on Coleman et al. (2010) and Lluberas and Odriozola (2014), as cited in Labat and Licandro (2021), to discuss inflation, poverty, inequality, and wealth distribution in Uruguay.
They consequently present the development of peso markets as a central bank contribution to social welfare. This argument does not imply that monetary expansion necessarily reduces inequality.
Dollarization in Uruguay was an unofficial historical process: the dollar expanded its roles in saving, credit, and valuation without legally replacing the peso as the national currency. There is therefore no single legal starting date comparable to one that might be identified in an official dollarization process. Licandro and Mello (2018, p. 368) trace its background to the 1950s. Monetary policy after 2002 must be understood within that longer trajectory.
The 2002 crisis exposed vulnerabilities associated with currency mismatches. Drawing on Licandro and Licandro (2001, 2003, 2010, as cited in Labat & Licandro, 2021), Labat and Licandro (2021) describe a two-pillar strategy: recognizing through regulation the risks and incentives that favored dollarization, and rebuilding peso markets to provide an alternative to dollar financing.
The regulatory agenda advanced in several directions. Recognition that the Central Bank cannot provide unlimited lender-of-last-resort support in foreign currency led to a deposit insurance scheme offering greater coverage in pesos than in dollars. Liquidity regulation was reformed, previous subsidies to dollar banking activity were removed, and peso reserve requirements were reduced. To address the exchange rate component of credit risk, access to the highest credit ratings was made conditional on balance sheet resilience under severe exchange rate stress.
Bank capital regulation was revised to incorporate exchange rate risk. Dollar exposure limits were also reduced for pension funds and insurance companies. Under the second pillar, floating removed the implicit exchange rate guarantee. Public debt management increased the share of peso liabilities, helping to develop a peso yield curve. Indexed instruments offered alternatives to the dollar: the Unidad Indexada (UI), linked to inflation, and the Unidad Previsional (UP), linked to wages. The Central Bank helped develop an exchange rate futures market, and public banks were oriented more strongly toward peso activity.
These measures illustrate the extensive monetary and financial regulatory reforms intended to reduce dollarization-related vulnerabilities. Regulation and supervision also improved in other areas. Labat and Licandro (2021) argue that charter changes allowed a substantial improvement in regulatory practice, assessed against established international standards. The UI and UP were not created simultaneously: the UP was established in 2018 (Law No. 19,608, 2018).
This overview combines measures introduced at different stages of the post-2002 agenda (Labat & Licandro, 2021).
Labat and Licandro (2021) note that the effectiveness of monetary policy has been highly contested in Uruguay. International institutions and domestic analysts have questioned its capacity to manage inflation because dollarization weakens monetary transmission, even though Uruguay’s dollarization is unofficial and does not involve a currency board regime.
On the positive side, Labat and Licandro (2021) argue that monetary and regulatory reforms substantially corrected currency mismatches and reduced financial fragility. As Figures 3 and 4 indicate, mismatches in corporate balance sheets were greatly reduced, while lower public debt dollarization reduced the public sector’s currency mismatch. Peso operations also increased their share of total transactions, dollarization fell on both sides of bank balance sheets, and evidence of reduced price dollarization appeared in some sectors.
On the negative side, Uruguay continued to exhibit shortcomings in peso market development and in long-term and risk financing. The authors interpret the reduction in fragility as having coexisted with a small, indexed financial system; this does not imply that all financial risk had disappeared.
Short-term foreign exchange positions of Uruguayan firms
Note. Approximate heights read from the chart, whose scale runs from −0.4 to 0.6. The reproduced figure does not specify the denominator of the foreign exchange position, so these values should not be interpreted as verified percentages. Adapted from Labat and Licandro (2021, Figure 2).
Dollarization in Uruguay: selected indicators, 2002 and 2019
Common scale: 0–100%. Dark tobacco: 2002 · light copper: 2019.
Note. Approximate values read visually from the published chart; these are not official microdata. AFAP refers to pension savings fund administrators. Adapted from Labat and Licandro (2021, Figure 3), who identify their own calculations based on BCU data.
Labat and Licandro (2021) conclude that insufficient inflation control and limited peso market development reinforce one another. This interaction creates inefficiencies in production and corporate balance sheet management, making it harder to consolidate an alternative to the dollar.
III. The dedollarization proposal in Uruguay
3.1. General framework
Sustainable dedollarization requires peso markets to offer a credible and functional alternative to dollar financing. Labat and Licandro (2021) organize their proposals around a new monetary policy framework and specific measures to rebuild domestic currency markets.
3.2. Credibility and expectations
Labat and Licandro (2021, p. 15) make the following argument (English translation):
The first and most important problem to correct is the lack of monetary policy credibility. Monetary policy institutions should therefore be reformed, for example by separating board appointments from the political cycle or requiring greater accountability. Although legal change would be desirable, provided fiscal and monetary policies are consistent, considerable room remains to improve the practices of existing monetary institutions.
Credibility helps economic agents align their expectations, and consequently their actions, with the monetary policy conducted by the central bank. A prerequisite is that agents understand the Bank’s objectives, which requires adequate information. Transparency helps them understand the Bank’s assessment of the economy and the effects of monetary policy, guiding expectations if a crucial condition is met: agents with sufficient economic influence to counteract policy must find those policies sufficiently beneficial to align their behavior with them to some degree.
This applies insofar as no legal and institutional framework compels those agents to achieve a specified degree of alignment with the policies in question.
3.3. Independence and accountability
Labat and Licandro (2021) propose strengthening the central bank’s operational independence and accountability. They identify as a 2020 improvement the separation of Macroeconomic Coordination Committee (CCM) and Monetary Policy Committee (COPOM) meetings, alongside less frequent CCM meetings and more frequent COPOM sessions. The central bank and the Ministry of Economy and Finance must coordinate financial stability, debt policy, and information exchange. The CCM should focus on long-term objectives, while monetary management remains the central bank’s responsibility.
Accountability should explain how decisions support the achievement of targets and why those targets were missed when deviations occurred.
3.4. Objectives and transparency
Labat and Licandro (2021) argue that, to strengthen accountability, the Central Bank’s reports to the executive branch and the public should explain how policy would achieve its objectives and why it had previously failed to do so.
Transparency is another dimension of Labat and Licandro’s (2021) program. The authors describe changes undertaken through 2021: publishing minutes and forward-looking statements, revising the monetary policy report, and increasing communication with analysts and the press. They also propose disclosing core inflation, forecasts, and explanations of target deviations. In their account, each decision is communicated through a short document followed by minutes, while quarterly information is supplemented with projections and public presentations. These mechanisms make the links between diagnosis, decisions, and results understandable. They further propose gradually lowering the long-term inflation target toward 3% and using the interest rate as the policy instrument.
The discussion of nominal adjustment space and incentives for carry trade belongs to the program formulated in 2021, rather than describing the targets in force at the time of this revision.
Policy implementation and market operations should be consistent with these principles. In Uruguay’s proposed framework, a target for headline CPI inflation is set within a range. The overnight money market interest rate is the key policy rate, supported by standing facilities and remuneration of excess reserves aligned with that rate. Smoothing volatility in short-term financial markets, including the foreign exchange market, is also important, provided it does not conflict with monetary policy’s principal objectives or undermine its communication (Labat & Licandro, 2021).
3.5. Balancing objectives
Labat and Licandro (2021, p. 15) make the following argument (English translation):
First, the balance of objectives must be interpreted in light of the discussion at the beginning of this essay. Because the inflation that supports growth and employment is low and stable, the Central Bank should normally ensure an inflation rate consistent with the long-term development of peso markets. There will, of course, be times like the present when clear emergencies require bold action to support the economy. Under normal conditions, however, such action should be permitted only to the extent that inflation expectations remain anchored to the long-term target.
3.6. The dedollarization program
Labat and Licandro (2021) explain that, as inflation converges toward a lower long-term target, microeconomic and macroeconomic measures can help reduce dollarization and improve peso markets. The dedollarization initiative has four principal avenues:
- Microeconomic reforms within the financial system
- Changes in borrowing policy
- Addressing price dollarization, particularly for durable goods.
- Studying and addressing the causes of dollarization at a more granular level.
As discussed above, the financial system had already undergone extensive reforms. Despite these changes, Labat and Licandro (2021) note that domestic currency deposits remained small, peso intermediation spreads remained wide, and access to peso financial products was still insufficient. Part of the problem stems from price dollarization, which encourages people to save in dollars to purchase durable goods. Another part reflects financial intermediation costs and the financial sector’s microstructure.
The authors nevertheless identify further, more granular explanations that require additional research.
Labat and Licandro (2021) further argue that borrowing policy, together with regulatory changes, has been a major contributor to progress in peso market development and dedollarization, while still leaving an unfinished agenda. Debt instruments denominated in indexed units 1 (UI) and pension units 2 (UP), together with the more recent push toward nominal peso instruments, are among the principal initiatives led by the Debt Management Unit. The Banco Central del Uruguay and that Unit were developing a new approach to coordinating debt issuance to deepen peso markets.
Expanding nonresident access to peso instruments through Euroclear and concentrating BCU issuance at shorter maturities were two measures under development to support this agenda.
Price dedollarization adds a further dimension by addressing the peso’s role as the economy’s numeraire. The evidence discussed suggests that price dollarization recedes as inflation declines. The experience of Peru also suggests that changes to consumer protection regulation can help reduce price dollarization. Because progress has nevertheless been slow, it is necessary to understand the underlying obstacles and persuade agents of the need to return to peso pricing.
Because the choice of numeraire is a coordination equilibrium, returning to peso pricing requires both persuasion and coordination: explaining the externalities that dollarization creates for growth, economic cycles, financial stability, and distribution; and working with stakeholders to identify the reforms needed to change established behavior (Labat & Licandro, 2021).
Labat and Licandro (2021) propose dialogue among financial institutions, public bodies, and firms to understand the specific mechanisms of dollarization. The aim is to identify regulations, practices, and laws requiring change, coordinate the peso’s return as the dominant numeraire, and use public communication to facilitate the process. Private behavioral alignment depends on the institutional conditions and incentives discussed above.
Finally, Labat and Licandro (2021) reaffirm that inadequate peso markets, arising from chronic inflation and embedded in government practices, culture, business, and the financial system, generate significant externalities requiring policy action. This points directly to cultural dollarization: the socially entrenched use of the dollar as a unit of account and a reference for value.
IV. References
Aboal, D., Lanzilotta, B., & Perera, M. (2006). ¿Flotación de jure y de facto? La política monetaria-cambiaria en el período poscrisis en Uruguay [De jure and de facto floating? Monetary and exchange rate policy in post-crisis Uruguay]. Centro de Investigaciones Económicas. https://www.bcu.gub.uy/Comunicaciones/Jornadas%20de%20Economa/iees03j3070806.pdf
Alegre, P. (2008). Democracia y reformas en el Uruguay: Un caso de gradualismo perverso [Democracy and reforms in Uruguay: A case of perverse gradualism]. Revista Uruguaya de Ciencia Política, 17(1), 137–158. https://revistasfcs.edu.uy/index.php/rucp/es/article/view/786
Banco Central del Uruguay. (n.d.). Deuda externa del Uruguay [Uruguay’s external debt; statistical report with data through December 2015]. https://web.archive.org/web/20160502222455if_/http://bcu.gub.uy/Estadisticas-e-Indicadores/Documents/Finanzas-Publicas/resdeu.pdf
El País. (2021, April 27). ¿Qué piensa hacer el gobierno para desdolarizar la economía uruguaya? El documento oficial [What does the government intend to do to dedollarize Uruguay’s economy? The official document]. https://www.elpais.com.uy/negocios/noticias/que-piensa-hacer-el-gobierno-para-desdolarizar-la-economia-uruguaya-el-documento-oficial
Instituto Nacional de Estadística. (n.d.). ¿Qué es la Unidad Indexada? [What is the indexed unit?] https://www.gub.uy/instituto-nacional-estadistica/comunicacion/publicaciones/preguntas-frecuentes/preguntas-frecuentes/es-unidad-indexada
Labat, D., & Licandro, G. (2021). Hacia una moneda de calidad: Documento de política [Toward a quality currency: Policy document] (Working Paper No. 004-2021). Banco Central del Uruguay. https://www.bcu.gub.uy/Estadisticas-e-Indicadores/Documentos%20de%20Trabajo/4.2021.pdf
Law No. 19,608, Creación de la Unidad Previsional (UP) [Creation of the pension unit (UP)]. (2018, April 13). Diario Oficial de la República Oriental del Uruguay, April 19, 2018. https://www.impo.com.uy/bases/leyes/19608-2018
Licandro, G., & Mello, M. (2018). Dolarización cultural y financiera de los hogares uruguayos [Cultural and financial dollarization of Uruguayan households]. In M. J. Roa & D. Mejía (Eds.), Decisiones financieras de los hogares e inclusión financiera: Evidencia para América Latina y el Caribe [Household financial decisions and financial inclusion: Evidence from Latin America and the Caribbean] (pp. 365–404). Centro de Estudios Monetarios Latinoamericanos. https://www.cemla.org/PDF/ic/ic-2016/ic-2016-11.pdf
V. Notes
- Indexed unit (Unidad Indexada, UI). A unit of value adjusted according to the CPI. Its value changes daily under the official methodology; indexation incorporates lags and should not be confused with an immediate adjustment to the price of every individual good (Instituto Nacional de Estadística, n.d.). ↩
- Pension unit (Unidad Previsional, UP). A unit of value created by Law No. 19,608 of 2018. It changes daily under the methodology linked to the Nominal Average Wage Index, with the lags specified in Article 2. ↩
Leave a Comment/Deja un Comentario