
LISTEN TO THIS POST AS A PODCAST
Does Money Drive Prices, or Do Prices Drive Money?
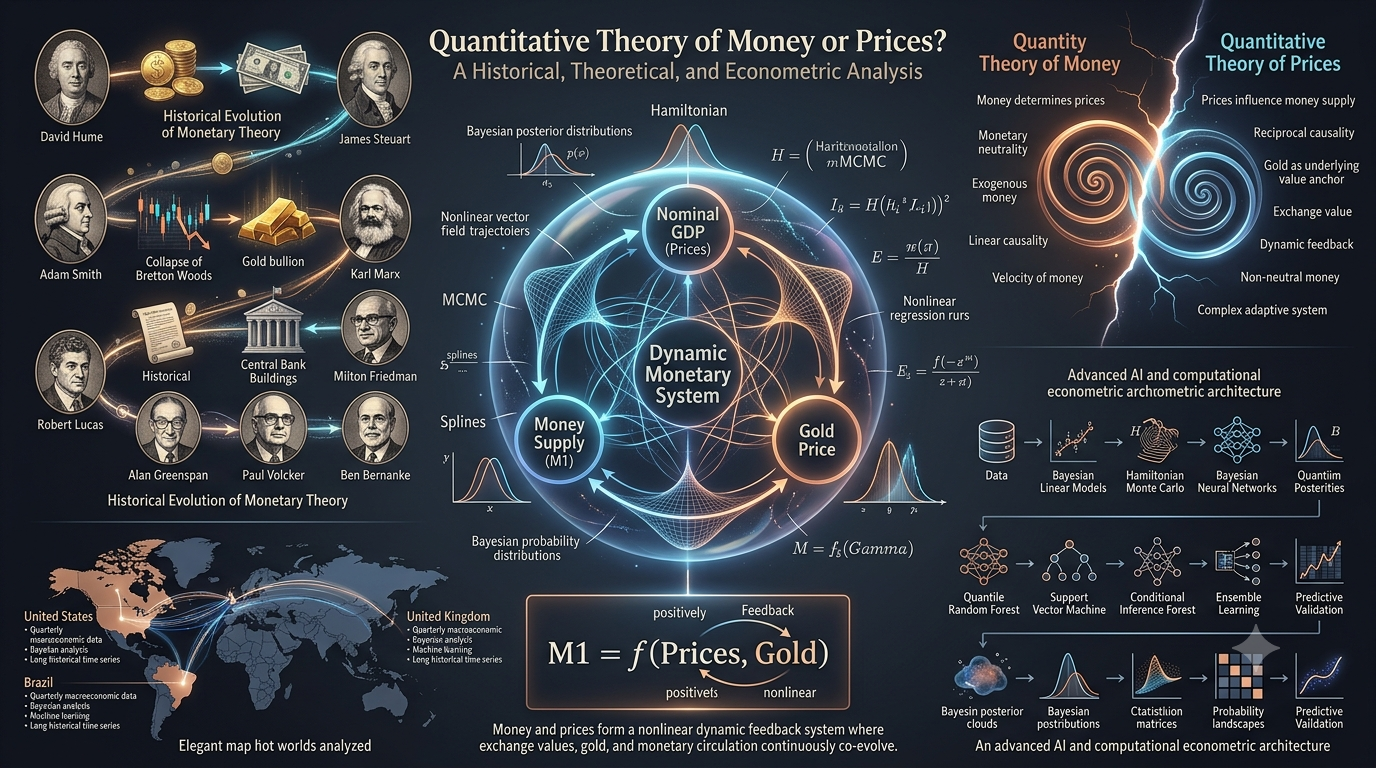
Hume versus Marx, four countries, up to six decades of quarterly data, Bayesian statistics and machine learning — a modern empirical test of competing theories about the relation between money, prices and gold
- The dispute between Hume and Marx — what each theory says is subordinate to what
- Marx’s critique of the Quantity Theory — four arguments and two empirical corollaries
- Gold after Bretton Woods — the paper’s case for a continuing indirect monetary role
- The mathematical model — the proposed relation among M1, nominal GDP and gold
- The econometric strategy — Bayesian regression, RESET, BGLMs, machine learning and ensembles
- Country-by-country evidence — United States, Canada, United Kingdom and Brazil
- Feedback and monetary non-neutrality — what the paper concludes and what the models directly establish
- Policy implications and open questions — where the argument leads and where research must continue
1. The Old Dispute: Which Variable Is Subordinate?
Few questions in monetary economics sound simpler than this one: does a larger quantity of money raise prices, or does the quantity of money required in circulation adjust to values and prices generated elsewhere in the economy? The difference is not semantic. It concerns the direction of determination between the monetary sphere and the production-and-exchange process that money expresses.
David Hume is the historical point of departure of the paper. His monetary writings became an important ancestor of later versions of the Quantity Theory of Money, including the tradition associated with Milton Friedman and Robert Lucas. In its familiar simplified form, this position places the quantity of money on the determining side of the money–price relation.
Yet Hume’s account was challenged from the beginning. James Steuart criticized it, Adam Smith held a different view, and Karl Marx later developed a systematic critique in the Contribution to the Critique of Political Economy.
Gómez Julián calls the alternative reconstructed from Marx the Quantitative Theory of Prices. Its central reversal is that commodity values and prices are not simply passive consequences of a monetary quantity imposed from outside. The amount of money required in circulation is itself conditioned by the values and prices it must express.
2. Marx’s Critique of Hume
The paper identifies four central aspects of Marx’s criticism. They matter because the subsequent econometric analysis is explicitly designed to examine propositions derived from this theoretical and historical reconstruction.
First: circulation is subordinate to production
In the Marxian framework developed by the paper, money belongs to the sphere of circulation, whereas the value relations that money expresses are ultimately rooted in the sphere of production. The quantity of circulating means of payment must therefore maintain a relation with the prices of the commodities and services being exchanged.
The paper argues that deviations from the quantity of money socially required for circulation generate corrective movements through the interaction of commodity prices and money. This does not make money powerless: money can affect aggregate demand and thereby feed back into prices. The relationship is therefore reciprocal through time even though the paper treats prices as the ultimately determining side.
Second: Hume’s evidence arose from a very particular historical episode
Marx’s epistemological criticism focuses on the historical circumstances behind Hume’s observations. The influx of American gold and silver coincided with changes in the conditions and costs of producing those precious metals.
From Marx’s perspective, one cannot therefore move automatically from the observed sequence “more precious metal, then higher prices” to the conclusion that an exogenous increase in money caused the general price increase. Gold and silver were themselves commodities whose own values could change.
The paper emphasizes Marx’s distinction between precious metals entering international exchange as commodities and those same metals acting as domestic means of payment. These adjustments need not occur simultaneously.
Third: the monetary unit is not identical to the means of circulation
Marx also criticizes the conflation of accounting money — the unit in which prices are expressed — with money in its concrete role as a means of circulation. For the paper, this distinction is central to deciding what actually functions as the sign of value.
Fourth: two empirically relevant corollaries
- Direction: if the monetary unit is the sign of value, the quantity of circulating money depends on the sum of commodity prices; if metallic currency itself is the sign of value, the opposite direction follows. Marx argues for the former.
- Relative magnitude: under the Marxian formulation, circumstances can exist in which circulating money exceeds the contemporaneous sum of commodity prices. The paper presents this as a point on which the competing logical structures differ.
The paper operationalizes circulating money as M1 and the sum of commodity prices as nominal GDP. It reports periods in which M1 exceeds nominal GDP in the United States, Canada, the United Kingdom and Brazil, and interprets these observations as evidence consistent with Marx’s second corollary.
This comparison is evidence within the logical test proposed by the article. It should not be confused with a complete econometric identification of the causal structure connecting all monetary and real variables.
The deeper question: what determines value?
The monetary argument is explicitly tied to Marx’s labor theory of value. In the paper’s reconstruction, capitalist competition generates market prices that fluctuate around centers of gravity grounded in the production process and expressed theoretically through prices of production.
The author therefore acknowledges that the monetary theory cannot be isolated from the validity or falsity of the broader theory of value on which it rests.
The paper also discusses the Cambridge Capital Controversies, aggregation problems, the Penn World Table’s treatment of capital remuneration, and the temporal interpretation of the transformation problem. These arguments form part of the theoretical defense surrounding the monetary model; they are not additional empirical results produced by the four-country econometric exercise.
3. Gold After Bretton Woods
Extending Marx’s argument into the contemporary period raises an obvious problem. Formal dollar convertibility into gold ended with the collapse of Bretton Woods. If the modern monetary unit nevertheless retains a commodity foundation in some sense, what is the mechanism?
Gómez Julián argues that gold continued to perform an indirect monetary role after formal convertibility disappeared. The paper combines historical evidence, statements by policymakers, and observed relationships involving gold and the dollar to defend what it calls a “loose gold standard.”
- Statements by policymakers: particular emphasis is placed on Alan Greenspan’s treatment of gold as an ultimate means of payment.
- Gold and the dollar: the paper points to their often inverse movement as evidence that gold remains informative about the international value of the dollar.
- Monetary-policy history: the paper interprets aspects of policy under Volcker and Greenspan, together with the Plaza and Louvre Accords, as attempts to stabilize the dollar in relation to gold and broader commodity prices.
The distinction between evidence and interpretation is important here. The historical material supports the proposition that gold remained economically and politically relevant after Bretton Woods. Describing the resulting regime as a “loose gold standard” is the author’s theoretical interpretation of that evidence. It is not the same thing as a legally fixed gold convertibility regime.
The paper extends this interpretation across the tenures of Volcker, Greenspan, Bernanke, Yellen and Powell. Changes in the behavior of gold and the dollar are discussed alongside changes in monetary-policy orientation. These historical comparisons should not be confused with a separate econometric causal identification of the policy regimes themselves.
The contradiction emphasized through Ernest Mandel
The paper uses Ernest Mandel to formulate a broader contradiction. An international monetary asset requires stability, yet a national capitalist economy may require monetary flexibility. The dollar therefore performs two roles whose requirements need not always coincide: international money and an instrument of domestic economic expansion.
4. The Mathematical Model: Money, Prices and Gold
The paper condenses its basic theoretical proposition into the following relationship:
\(Q_m\) denotes the circulating money supply, operationalized empirically as M1. \(\lambda_p\) denotes the sum of commodity prices, operationalized as nominal GDP. \(\lambda_{\mathrm{gold}}\) is the international price of gold.
The coefficient \(\beta\) deserves special attention. It is not itself the velocity of money. In the paper it is defined as the reciprocal transformation:
where \(v\) denotes the velocity of circulation. In the basic theoretical exercise, velocity is treated as exogenous and set equal to one, implying \(\beta=1\).
- Holding gold fixed, a higher nominal sum of prices implies a larger quantity of circulating money.
- Holding prices fixed, a higher gold price implies a smaller quantity of circulating money in the basic specification.
- When prices and gold move in the same direction, the result for money depends on their relative magnitudes.
- When prices rise while gold falls, both movements push the basic equation toward a larger quantity of circulating money.
The paper works through the possible combinations of movements in the two explanatory quantities as a logical consistency exercise. With \(\beta=1\), the equation can also be written in logarithms:
The logarithmic form motivates elasticity interpretations and can also make empirical relationships easier to model. Crucially, however, the econometric work does not force the gold effect to remain a simple constant negative coefficient.
The paper therefore introduces the more general relation \(Q_m=f(+\lambda_p,\pm\lambda_{\mathrm{gold}})\): prices are expected to relate directly to circulating money, while the gold relationship is allowed to change direction across different segments or circumstances.
5. The Data and the Econometric Strategy
Four countries
The empirical analysis uses quarterly data from four economies:
- United States: 1959–2022 — approximately 63 years.
- Canada: 1961–2022 — approximately 61 years.
- United Kingdom: 1986–2022 — approximately 36 years.
- Brazil: 1996–2022 — approximately 26 years.
The paper chooses these countries deliberately. The United States is treated as the most developed Western capitalist case; the United Kingdom as another advanced capitalist economy; Canada as a differentiated welfare-state variant; and Brazil as an emerging economy.
The author argues that common findings across such cases support a broad generalization about capitalist development. Methodologically, however, evidence from four countries remains cross-country replication across four cases rather than a logical proof that the same result must hold in every capitalist economy.
Stage 1: pairwise directional comparison
The first stage compares Bayesian simple linear regressions for three pairs: money and prices, gold and prices, and money and gold. The preferred direction is selected using predictive criteria including ELPD-LOO and, in some cases, the log-fit ratio.
- The comparison tells us which regression direction receives stronger predictive support under the paper’s criteria.
- A comparison between \(Y=f(X)\) and \(X=f(Y)\) does not, by itself, constitute experimental or quasi-experimental causal identification.
- The paper’s stronger interpretation of causal direction combines the econometric comparison with its historical and theoretical argument.
Stage 2: testing whether linearity is adequate
Ramsey RESET tests are applied with quadratic, cubic and combined quadratic–cubic terms and are robustified through Bayesian bootstrapping. The results show very strong evidence against a simple linear form for a number of important relationships, particularly those involving M1.
But the pattern is not literally identical for every country, every pair and every RESET specification. Some gold–price specifications, for example, do not reject the simpler form under all versions of the test. The faithful conclusion is therefore that nonlinearity is important and often very strong, rather than that every relation is proven nonlinear without exception.
Stage 3: fitting empirical distributions
Candidate distributions are fitted to the observed variables through the maximum-goodness-of-fit procedure, with BIC used for comparison. These distributional results are subsequently used to motivate some of the transformations entering the Bayesian generalized linear models.
Stage 4: Bayesian generalized linear models
The central multivariate specification models log M1 using nominal GDP and gold. Different statistical families, links and transformations are compared. Gold can enter through a natural cubic spline, allowing its relationship with money to vary over the observed range, or through a transformation based on a fitted distribution.
Model assessment includes MAE, RMSE, ELPD-LOO, P-LOO, LOO-IC, PSIS-LOO diagnostics, Monte Carlo standard errors and generalized variance-inflation measures. \(R^2\) is used where the statistical family makes the corresponding measure available.
Stage 5: machine learning and deep learning
- Quantile Random Forest (QRF)
- Conditional Inference Random Forest
- Bayesian Regularized Neural Network (BRNN)
- Support Vector Machine with Radial Basis Function kernel (SVMRadial)
Candidate hyperparameters are compared through repeated cross-validation with 10 folds and 100 repetitions, using a 20% test partition. Performance is assessed through measures including \(R^2\), AIC, MAE, RMSE and deviance comparisons.
Because the observations are time series, these predictive exercises should be interpreted as results under the paper’s stated resampling design, not automatically as the equivalent of a strictly chronological rolling or walk-forward forecasting experiment.
Stage 6: ensemble learning
The paper finally asks whether combinations of models can improve on their individual components. Ensembles are built through a Bayesian generalized linear model with Gaussian family and identity link.
Among the four national cases, the selected ensemble improves on the individual alternatives in the United States. In Canada, the United Kingdom and Brazil, an individual machine-learning model remains the preferred solution.
What “objective Bayesian” means here
The study explicitly describes its Bayesian methodology as objective Bayesian. In operational terms, prior quantities such as prior \(R^2\) and the prior intercept are obtained from preliminary frequentist analyses of the empirical data rather than from elicited subjective beliefs.
That clarification matters because “objective Bayesianism” can refer to several traditions. In this paper, the practical feature to keep in mind is the empirical anchoring of prior information through preliminary statistical analysis.
6. Country-by-Country Results
United States — 1959–2022
For the simple M1–prices comparison, the paper reports an undecidable result: neither regression direction dominates under the combined log-fit-ratio and ELPD-LOO criteria.
For the other two pairs, the preferred models are gold as a function of prices and M1 as a function of gold. The author interprets these results, together with the theoretical analysis, as compatible with a prices–gold–money structure. The pairwise regressions alone, however, do not constitute independent causal identification of such a chain.
RESET strongly rejects the simple linear form in both directions of the M1–prices pair. The price–gold results are more nuanced: one direction shows little evidence against linearity in the reported tests, while the reverse direction shows stronger evidence in at least part of the RESET battery.
The selected multivariate model is a Gamma BGLM with logarithmic link, with gold represented through a natural cubic spline with five degrees of freedom. The fitted coefficient on log nominal GDP is +0.13.
The five gold-spline coefficients are \(-0.35\), \(-0.01\), \(-0.04\), \(+0.09\), and \(+0.21\). The important feature is therefore not an alternating sign pattern but the coexistence of negative and positive regions, which is consistent with the paper’s segment-dependent interpretation of the gold–money relation.
The BGLM reports MAE \(=0.12\) and RMSE \(=0.21\). The subsequent ensemble combines a Bayesian Regularized Neural Network with weight approximately \(0.41\) and a Quantile Random Forest with weight approximately \(0.59\).
The ensemble reports training \(R^2=0.985\), test MAE \(=0.08\), and test RMSE \(=0.25\). The \(R^2\) figure is specifically a training statistic; it should not be described as a held-out test \(R^2\).
Canada — 1961–2022
Canada produces the cleanest pairwise ordering under the paper’s comparison criterion: M1 is preferred as a function of prices, gold as a function of prices, and M1 as a function of gold.
RESET strongly rejects simple linearity for the money–prices and money–gold relations, while the price–gold results are less uniform across the separate quadratic, cubic and combined tests.
The selected multivariate specification is a Gamma BGLM with logarithmic link. Gold enters through a transformation associated with the best-fitting Weibull distribution, whose estimated shape is approximately \(5.88\) and scale approximately \(6.47\). The coefficient on log nominal GDP is +0.045.
The BGLM reports MAE \(=0.23\) and RMSE \(=0.28\). Among the machine-learning alternatives, the Quantile Random Forest performs best under the paper’s criteria.
Its reported training \(R^2\) is 0.9983, with training MAE \(=0.04\), test MAE \(=0.04\), and test RMSE \(=0.08\). Again, the near-one \(R^2\) belongs to the training sample; the reported test errors are the more relevant numbers for the held-out partition.
United Kingdom — 1986–2022
The UK provides an important counterexample to any claim that the pairwise procedure mechanically produces the same answer everywhere. For M1 and prices, the preferred bivariate specification is prices as a function of M1.
- In Table 12, the row comparing gold and prices prints the “best model” as log(Gold) = f(log(Gold)).
- That expression is self-referential and appears to be a typographical error in the published table.
- Rather than silently replacing it with an inferred direction, this summary leaves the preferred bivariate direction for that specific row unresolved.
For the M1–gold pair, Table 12 does clearly report M1 as a function of gold. The RESET results again reveal substantial nonlinearity, although the exact pattern depends on the functional direction and test specification.
In the multivariate stage, the selected model is a Gamma BGLM with logarithmic link and a five-degree-of-freedom natural cubic spline for gold. The coefficient on log nominal GDP is +0.071.
Its gold-spline coefficients include both positive and negative values: \(+0.0001\), \(+0.012\), \(-0.001\), \(+0.006\), and \(+0.01\). The paper interprets this as a gold–money relation whose local direction varies across the relevant range.
The BGLM reports MAE \(=0.06\) and RMSE \(=0.07\). A Quantile Random Forest is the best-performing machine-learning model, with training \(R^2=0.993\), test MAE \(=0.04\), and a test RMSE reported as approximately zero at the precision shown in the paper.
Brazil — 1996–2022
Brazil also differs from Canada. The pairwise comparison prefers prices as a function of M1, prices as a function of gold, and M1 as a function of gold. The original blog description of the gold–prices result as simply “bidirectional” was therefore too loose.
The Brazilian RESET results contain particularly strong evidence against simple linear specifications: most of the reported posterior-bootstrap mean p-values are zero or very close to zero.
Brazil is the only country whose selected multivariate model uses a Gaussian family. It nevertheless retains a logarithmic link and a five-degree-of-freedom natural cubic spline for gold. The coefficient on log nominal GDP is +0.05.
The gold spline again contains coefficients of both signs, and the paper interprets the relationship between gold and circulating money as varying by range. The BGLM reports MAE \(=0.07\) and RMSE \(=0.21\).
Among the machine-learning candidates, SVMRadial performs best under the paper’s comparison. It reports training \(R^2=0.991\), test MAE \(=0.012\), and test RMSE \(=0.016\).
7. Feedback, Complexity and Monetary Non-Neutrality
The paper’s explicit conclusion is strong: money is not neutral in either the short run or the long run. It reaches this conclusion within a theoretical framework whose explanation differs fundamentally from the standard Quantity Theory.
Non-neutrality is not attributed to circulating money unilaterally determining prices. Instead, the paper proposes a feedback mechanism: prices condition the required amount of circulating money through the exchange value of the monetary unit and its real foundation, while money can feed back into prices through aggregate demand.
The econometric evidence shows important nonlinear relationships among M1, nominal GDP and gold. The author combines those results with the theoretical feedback mechanism and describes the resulting relation as a complex system.
- The empirical models directly analyze M1, nominal GDP and gold.
- Conventional monetary-neutrality tests are often formulated in terms of lasting effects of monetary variables on real variables such as real output or employment.
- The paper’s conclusion of non-neutrality at every horizon therefore belongs to its broader theoretical and empirical synthesis; the four-country models are not a separate standard horizon-by-horizon neutrality test on real output and employment.
The same distinction helps with the paper’s use of complexity and chaos theory. Evidence of nonlinearity and feedback supports the claim that simple linear descriptions are inadequate. It does not, by itself, constitute an empirical demonstration of deterministic chaos through quantities such as a positive Lyapunov exponent or a strange attractor.
8. Policy Implications and the Questions Still Open
Direct price intervention and monetary policy
The policy argument contains two conclusions that are compatible within the paper’s feedback framework.
- Act on the determinants of prices themselves. Because the theory ultimately roots prices in production and competition, the author argues that interventions affecting the real determinants of costs and prices are the most direct route to price control.
- Monetary contraction can nevertheless influence prices. The feedback mechanism allows changes in M1 to affect aggregate demand and therefore feed back into prices even though M1 is not treated as the ultimately determining variable.
- Major crises cannot necessarily be reduced to monetary policy alone. The discussions of the Great Depression and the 2008 crisis are used against an exclusively monetary explanation and in favor of including fiscal, financial and real-economy mechanisms.
- Gold and employment stability. The paper disputes the claim that attention to a gold anchor is necessarily incompatible with employment stability. This is a historical-policy argument of the paper rather than a causal effect separately estimated by the four-country regressions.
Two questions the paper explicitly leaves unresolved
The conclusion does not pretend that the contemporary monetary mechanism has been fully identified. It explicitly opens two further research problems.
First: if the post-Bretton-Woods relationship is indeed the loose gold arrangement proposed by the paper, how exactly do policy instruments mediate the feedback among prices, gold and M1? Interest rates, monetary expansions and contractions, and other policy tools would have to enter the system as mediating or latent variables.
Second: if money is non-neutral, what are the quantitative and temporal limits of that non-neutrality? How far can M1 deviate from the level required for circulation, and how long does the proposed coercive correction through prices take?
The paper suggests that answering the second question could also provide a different perspective on phenomena such as the liquidity trap.
What the machine-learning layer contributes
One unusual aspect of the research is methodological. A monetary argument rooted in Marx’s nineteenth-century critique is examined using Bayesian inference, posterior-bootstrap specification tests, generalized models, random forests, a Bayesian regularized neural network, support-vector machines and ensemble learning.
These tools strengthen the analysis by asking whether flexible models reproduce the statistical relationships and by comparing predictive performance across alternative specifications. What they do not do automatically is transform observational association into causal identification.
The paper’s causal interpretation therefore remains a synthesis of historical reasoning, theoretical structure and econometric evidence, rather than something supplied by machine learning alone.
The Takeaway
The most defensible summary of the paper is more precise than either “money causes prices” or “prices cause money.” Its theoretical framework is asymmetric but reciprocal: prices are treated as ultimately determining the quantity of circulating money, while money can feed back into prices through aggregate demand.
The empirical evidence does not mechanically return the same bivariate direction in every country. The U.S. money–prices comparison is undecidable under the paper’s criterion; Canada favors M1 as a function of prices; and the United Kingdom and Brazil favor prices as a function of M1 in the simple pairwise comparison.
What is common across all four selected multivariate models is that nominal GDP enters positively in the M1 equation, while the gold term requires a nonlinear or transformed representation. That cross-country result is the clearest econometric regularity supporting the paper’s broader theoretical construction.
The author then interprets these findings through Marx: the quantity of circulating money is ultimately subordinated to the price and value structure it expresses, yet it remains capable of affecting the system that determines it. From this feedback the paper derives its claim of monetary non-neutrality.
That also defines the next research frontier: explicitly modeling the policy instruments mediating the gold–money relation, identifying the temporal dynamics of the feedback more directly, testing monetary neutrality against real variables, and replicating the framework across additional countries and monetary regimes.


Leave a Comment/Deja un Comentario