Espartaco

“Is that to say we are against Free Trade? No, we are for Free Trade, because by Free Trade all economical laws, with their most astounding contradictions, will act upon a larger scale, upon the territory of the whole earth; and because from the uniting of all these contradictions in a single group, where they will stand face to face, will result the struggle which will itself eventuate in the emancipation of the proletariat.”

Karl Heinrich Marx · Marx-Engels Collected Works, Vol. VI, p. 290

25,834 views since December 2020

25,834 visitas desde diciembre de 2020

EnglishEspañol

Category: Mathematics

  • bayesianOU: Exploring Market Price Gravitation via Ornstein-Uhlenbeck Process

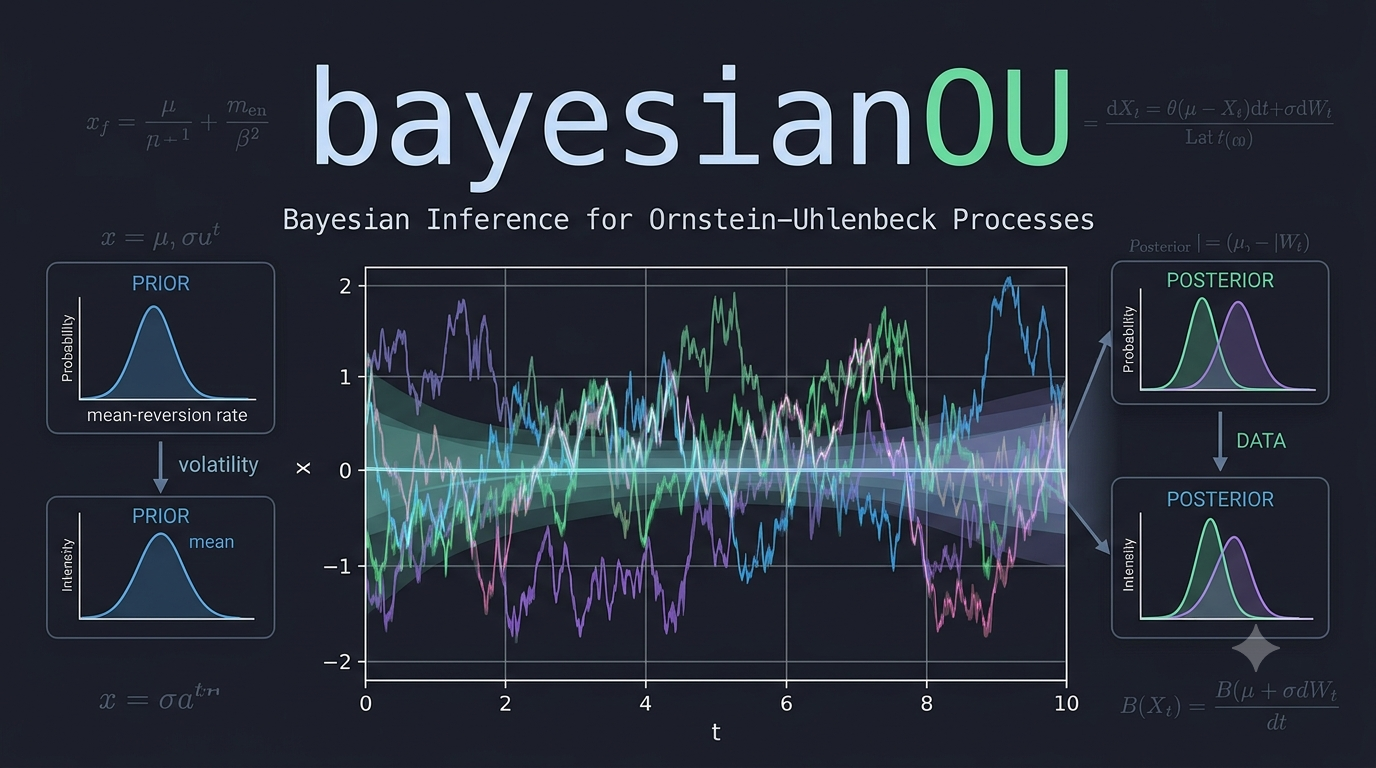
    bayesianOU: Exploring Market Price Gravitation via Ornstein-Uhlenbeck Process

    You can also find this library at CRAN and download it directly from R and RStudio.

    When Market Prices Gravitate: A Bayesian Look at an Old Question in Economics

    An old question, asked again — properly

    There is a question in economics that is older than most of the academic disciplines that border it. Do market prices — the noisy, day-to-day, here-and-now prices at which goods actually change hands — tend to settle toward some underlying center of gravity? And if they do, how fast, how violently, and through what mechanism?

    Classical political economy, from Smith and Ricardo through Marx, thought they do. The idea was that behind the churning surface of market prices there sit “prices of production”: long-run, cost-anchored prices toward which actual prices are pulled, the way a spring pulls a weight back toward its rest position. In the Marxian version, there is one more layer underneath: those prices of production themselves are supposed to gravitate around “values,” the labour embodied in commodities. Whether any of this is true is an empirical question, and for a long time the empirical tools to answer it were not really up to the job.

    A small R package called bayesianOU, written by José Mauricio Gómez Julián and hosted on GitHub, takes a serious swing at that question. It is not the first attempt to test price gravitation statistically, but it is one of the most technically careful I have seen, and it is built in a way that is instructive far beyond the Marxian debate that motivates it. What follows is a walkthrough of what the package does, why it is interesting, and — just as importantly — where it honestly admits its own limits.

    The tool that makes it possible: the Ornstein-Uhlenbeck process

    Strip the economics away for a moment and the statistical core of the package is a workhorse object from physics: the Ornstein-Uhlenbeck (OU) process. Imagine a particle moving in a fluid, attached to a spring. Brownian motion jiggles it randomly; the spring pulls it back toward a fixed point. The further it drifts away, the harder the pull. The result is a wiggly series that never settles but always tends to settle — a mean-reverting random walk.

    The OU process is exactly the mathematical object you want when you suspect a variable is noisy but anchored. It has a “speed of reversion” (how hard the spring pulls) and an “equilibrium level” (where the spring’s rest point is). Estimate those, and you can say something quantitative about gravitation: not just “yes, prices come back,” but “they come back with a half-life of about nine years.”

    That number — the half-life — is the prize. It is the difference between “market prices eventually settle” (which could mean anything) and “market prices settle on a timescale comparable to a business cycle” (which is a falsifiable, interpretable claim).

    What the package actually builds

    The package fits, by Bayesian inference, a family of models built on the OU process but considerably richer than the textbook version. There are two first-class models, sharing one inference engine.

    The single-level model

    The first model asks: do market prices revert toward an equilibrium that is a function of the prices of production, and what does that reversion look like once we let it be nonlinear, volatile, heavy-tailed, and structurally heterogeneous across sectors?

    Each of those adjectives is doing real work, and each corresponds to a feature that simpler approaches handle poorly or not at all:

    • Nonlinear drift. A plain OU process pulls back with a force proportional to the deviation. The package allows a cubic correction, so the restoring force can strengthen super-linearly when prices are far from equilibrium. This matters: real markets may behave gently near the center and violently at the extremes, and a linear model cannot represent that.
    • Stochastic volatility. Financial data, and economic data generally, go through quiet stretches and turbulent ones. The package does not assume a single noise level; it lets the volatility itself wander over time, following its own mean-reverting process on the log-variance. This is the same idea that powers modern stochastic-volatility models in finance, and it is essential for not fooling yourself about the precision of your estimates.
    • Heavy tails. Economic shocks are not Gaussian. Crashes, booms, and policy shocks produce outliers that a normal distribution would call essentially impossible. The package uses Student-t innovations and estimates the degrees of freedom from the data, so the model can discover for itself just how fat-tailed the world is.
    • Hierarchical structure across sectors. An economy has dozens of sectors, and each one presumably has its own reversion speed, its own equilibrium, its own noise. Estimating each sector in isolation throws away the information that they are all part of the same economy. Estimating them all with one set of parameters pretends they are identical. The package takes the middle path — hierarchical, or “partial pooling,” priors — where each sector’s parameters are drawn from a shared distribution whose properties the model also estimates. Sectors borrow strength from one another without being forced into lockstep.
    • A time-varying coupling. This is the most economically loaded feature. The strength with which market prices track prices of production is allowed to depend on the aggregate profit rate (what the package calls TMG). When the general rate of profit is high, the pull of production prices on market prices may be one thing; when it is low, another. Whether that modulation exists, and in which direction, is a hypothesis the model can test rather than assume.

    All of this is estimated jointly, with full Bayesian uncertainty, using Stan’s Hamiltonian Monte Carlo sampler. You do not get a point estimate of the reversion speed; you get a posterior distribution, and from it a credible interval and a probability statement like “there is a 95% chance the half-life is between six and eighteen years.”

    The nested cascade

    The second model is the more ambitious one, and it is where the package earns its “nested” branding. Instead of market prices reverting to a fixed equilibrium, they revert to a latent production price — a hidden, unobserved series that itself evolves over time according to its own OU process, driven by the general profit rate. And, if you turn on the third level, that latent production price in turn gravitates around an observed “value” index built directly from labour-content accounting.

    So the full structure is a cascade: market price → latent production price → value. Each arrow is an OU reversion, each with its own speed, and the speeds are constrained so that the outer (market) layer reverts faster than the inner (production) layer — an economically natural separation of timescales, enforced softly so the data can push back.

    The reason this matters is that it converts a slogan — “prices of production gravitate around values” — into a literal statistical hierarchy that can be fit to data and compared against alternatives. The headline empirical result, from a fit to 37 US sectors over 1960–2020, is a value-coupling coefficient essentially equal to one, with the posterior probability of it being positive effectively equal to one. In plain terms: in standardized units, prices of production track labour values almost one-for-one. That is a found result, not an assumed one — the prior on the coupling was centred at zero, deliberately neutral.

    The inference engine, and why it is not a footnote

    It would be easy to glance at the model description, nod, and move on. But how these quantities are estimated is half of what makes the package serious, and it is worth a paragraph for readers who do not think about MCMC every day.

    Bayesian inference works by exploring the space of all parameter values consistent with both the data and the prior, and characterizing that space as a probability distribution. For models this complex — with latent volatility paths, hierarchical structure, and hundreds of parameters — you cannot do that with pencil and paper. You use a Markov chain Monte Carlo sampler, specifically Hamiltonian Monte Carlo, which borrows an idea from physics: give the parameter space a “potential energy” (the log-posterior) and a “kinetic energy” (a randomly chosen momentum), and let the system glide around the posterior like a ball rolling over a landscape.

    Stan’s NUTS sampler automates this about as well as it can be automated, and the package uses it with within-chain parallelism (via Stan’s reduce_sum) to handle the fact that the likelihood must be summed over many timepoints and sectors. The diagnostics — R-hat for chain agreement, effective sample size, divergence counts — are surfaced through a validate_ou_fit function, and the package is explicit that you should look at them before believing anything.

    Model comparison is done with PSIS-LOO, a clever technique that approximates leave-one-out cross-validation without refitting the model dozens of times, by reweighting the posterior draws using importance sampling. It is the modern standard, and the package is appropriately cautious about it: because the model has a latent volatility state at every observation, plain LOO is known to be optimistic, and the documentation says so plainly.

    The honesty that makes it credible

    Here is where the package surprised me, and here is why I think it deserves a wider audience than the Marxian-economics niche it lives in.

    A naïve reading of the results would be triumphant: the value coupling is one-to-one, the reversion exists, the half-life is about nine years. But the package’s own validation section does something rare. It runs the model against legitimate rivals on genuinely held-out data — a full decade, 2011 to 2020 — and reports, without spin, that a random walk beats the OU model at forecasting, that a no-gravitation restriction ties or beats it, and that the value term adds no detectable predictive density.

    That sounds like a refutation. The package argues, carefully, that it is nothing of the sort — and the argument is the most intellectually interesting thing here.

    The key move is to distinguish two different questions. One is structural: does a reversion mechanism exist, and how fast is it? The other is predictive: can you forecast next year’s price better than a naïve benchmark? These are related but not identical, and for a slow process they come apart in a specific, predictable way.

    If gravitation is real but slow — a half-life of nine years on a dataset whose test window is a decade — then over the forecast horizon the process looks, to first order, like a random walk. The reversion is there, but it is too weak to show up in a one-step or few-step prediction. The random walk, which assumes no reversion, will forecast almost as well, because over short horizons a barely-reverting process and a non-reverting one are nearly indistinguishable. So the random walk winning the forecasting horse race is not evidence against gravitation; it is evidence consistent with gravitation being slow.

    This is not special pleading. It is a logical point about what different functionals of a model can and cannot tell you. The structural parameters — estimated from the joint likelihood over the whole panel, borrowing strength across 37 sectors and 61 years — use far more information than any single-series forecast. They can pin down a central tendency that a univariate test cannot. And the package shows, through simulation-based calibration and adversarial negative controls, that the estimation pipeline does not manufacture gravitation when none is present: feed it a true random walk and it reports a half-life of about fifty years; feed it a null value-coupling and the posterior honestly covers zero.

    The low-kappa trap, and why it matters to everyone

    The package names a difficulty it calls the low-kappa trap, and it is worth understanding because it is a trap that catches far more than Marxian price theory.

    Kappa is the reversion speed. As kappa shrinks toward zero, the OU process approaches a pure random walk. The trouble is that there is no bright line separating “slow mean reversion” from “no mean reversion.” It is a continuum, and three distinct problems stack up exactly there:

    • Algebraically, reversion speed and discrete-time persistence are two sides of the same coin; kappa going to zero is the same as the autocorrelation going to one. There is no internal frontier.
    • Statistically, the power of a unit-root test — the standard tool for asking “is this a random walk?” — collapses exactly as the truth approaches the random walk boundary. With a finite sample and a half-life comparable to the sample length, the test simply cannot tell. This is a well-known result in econometrics, and it is why decades of “is the real exchange rate stationary?” papers argued past one another.
    • Numerically, if the reversion speed is parameterized to be strictly positive (as it must be, for the sampler to behave), then “the probability that kappa is greater than zero” is trivially one — it tells you nothing. The informative quantity is the half-life, and the probability that the half-life exceeds some sensible horizon.

    The package’s response to the trap is instructive. It does not pretend the trap is not there. It states all three layers explicitly, reports the slow tail honestly (one sector has a non-trivial posterior probability of a half-life beyond forty years), and argues that the joint hierarchical posterior — which pools information across the whole panel — is a more powerful discriminator than any univariate test. That is a defensible position, and it is stated with the caveat attached rather than buried in a footnote.

    This is the broader lesson. Anyone working with time series that might be slowly mean-reverting — interest rates, real exchange rates, commodity prices, climate variables, pollutant concentrations — runs into exactly this trap. The package’s framing of it, in three layers, is one of the clearest expositions I have read, and it would travel well into any of those domains.

    What I appreciate, and what I would watch for

    A few things stand out as genuinely good practice, and they are worth naming because they are rarer than they should be.

    The separation of economic and sampler convergence. The package is scrupulous about not confusing two senses of “convergence.” Economic convergence — does the price revert? — is a statement about kappa and the half-life. Sampler convergence — did the MCMC chains agree? — is a statement about R-hat and divergences. These share a word and nothing else, and conflating them is a classic source of muddled reasoning. The documentation keeps them lexically distinct throughout.

    Neutral priors on the load-bearing hypotheses. The prior on the profit-rate modulation is centred at zero. The prior on the value coupling is centred at zero. The package does not bake the answer into the question. When the posterior then moves clearly away from zero, that means something.

    Out-of-sample integrity by construction. A subtle and common error in time-series work is “leakage”: accidentally letting future information contaminate the training procedure, so that out-of-sample results are secretly in-sample. The package offers a fit_window switch that keeps the two designs genuinely separate, and it computes the common-factor loadings from the training window only. This is the kind of plumbing detail that separates trustworthy work from work that just looks trustworthy.

    The negative results are reported. Many packages, and most blog posts about them, would quietly omit the fact that a random walk out-forecasts the model. This one leads with it and then reasons about it. That is how a field accumulates reliable knowledge rather than just encouraging headlines.

    What should a careful reader watch for? The half-life estimate of about nine years is, by the package’s own account, probably conservatively slow — a controlled study of the disaggregation step suggests the true figure may be closer to seven or eight. The cubic nonlinearity is a minor refinement on this data (its coefficient sits near its prior). The Student-t degrees of freedom and the stochastic-volatility scale are weakly identified when both are present, a known tension the documentation flags but does not resolve. And the headline value-coupling result, while striking, is measured on standardized levels that share a cost-price component by construction; the package defends this with a “wedge” argument — subtracting the shared component and testing the residual — but a sceptical reader should follow that argument itself rather than take it on trust.

    None of these caveats undermine the project. They are the project. A statistical framework that cannot articulate its own soft spots is not a framework you should believe.

    Why it is worth your time

    You do not need to be a Marxian economist, or any kind of economist, to get something out of this package. If you work with time series that exhibit slow, noisy reversion toward a moving target — and a great deal of the physical and social world does — the modelling ideas here are directly portable: the nonlinear OU drift, the stochastic volatility, the hierarchical pooling across groups, the careful separation of structural estimation from forecasting, and the three-layer diagnosis of the low-reversion trap.

    And if you are interested in the classical question of whether prices gravitate toward values, this is about as good a statistical treatment as you will find: modern machinery, honest reporting, and a willingness to let the data argue back against the theory that motivated the exercise in the first place.

    The repository, the full mathematical specification, the validation blocks, and a frank discussion of every methodological decision live at github.com/IsadoreNabi/bayesianOU, with the wiki carrying the complete technical detail. Read the methodology notes before you quote a number; that is what they are there for.

  • topologyR: Turning Time Series into Shapes to Test What Your Models Quietly Assume

    topologyR: Turning Time Series into Shapes to Test What Your Models Quietly Assume

    You can also find this library at CRAN and download it directly from R and RStudio.

    There is a habit so embedded in quantitative work that most practitioners never think to question it. You have a time series — quarterly GDP, an EEG channel, a temperature record — and at some point you fit a smooth curve through it, interpolate a missing value, or estimate a “long-run trend.” All of these moves rest on a single, seldom-checked assumption: that the data form one continuous whole, that a single smooth function can legitimately pass through every point.

    But what if they don’t? What if your series is, structurally, two or three disjoint pieces glued together by the calendar — pieces between which no continuous function can travel? In that case, the spline you just fitted is not an approximation of reality; it is a mathematical fiction painted over a fracture.

    topologyR is an R package that lets you check this before you model. It takes a numeric time series, converts it into a graph, converts that graph into a topological space, and then asks the one question that determines whether global continuous methods are even valid: is this space one connected piece, or several?

    It sounds abstract. It is abstract — but the consequence is concrete. The package is the work of José Mauricio Gómez Julián, and it is open-source, with a GitHub repository, a detailed Wiki, and a companion research paper archived on Zenodo. What follows is a tour of what the package does, why it matters, and where it fits in the broader landscape of topological data analysis.


    The Hidden Assumption

    Think about what happens when you impute a missing value in a time series using a cubic spline. The spline assumes that the points on either side of the gap belong to the same continuous process — that the missing value lies somewhere along a smooth bridge between them. If the series has actually undergone a structural break, a regime change, or a discontinuity between those points, the spline will happily produce a number, and that number will be wrong in a way no confidence interval can capture.

    This is not a niche problem. It appears in econometrics (trend estimation across business cycles), in neuroscience (coherence across brain-state transitions), in climatology (warming trends across regime shifts). The methodological error is always the same: assuming continuity without first verifying that continuity is mathematically possible.

    topologyR’s contribution is to make that verification explicit, parameter-free, and exact.


    From Numbers to Shapes: The Pipeline in Three Steps

    The package’s workflow has an elegant, almost architectural logic. You feed it a series of numbers; it returns a topological verdict. Between input and output, three transformations occur.

    Step 1: The Series Becomes a Graph

    The first move is borrowed from network science: the visibility graph. Imagine your time series plotted as a mountain range — each observation is a peak or a valley at a given time. Two points are connected by an edge if you could stand on one and see the other, with no taller peak blocking the line of sight.

    topologyR implements two flavours. The Horizontal Visibility Graph (HVG) connects two points if every point between them is strictly lower than the shorter of the two — a horizontal line of sight. It runs in linear time and captures the skeleton of the series’ ups and downs. The Natural Visibility Graph (NVG) is more generous: it connects two points if every intermediate point lies below the straight line joining them, regardless of the heights of the endpoints. It is denser, richer, and runs in O(n log n) expected time. The NVG always contains the HVG as a subgraph.

    Both are parameter-free. There is no threshold to tune, no bandwidth to select, no ε to agonise over. The graph is determined entirely by the data’s own geometry. This matters enormously: it eliminates the single largest source of arbitrariness in the entire pipeline.

    Step 2: The Graph Becomes a Topology

    Here is where topologyR departs from ordinary network analysis. A graph tells you who is adjacent to whom. A topology tells you something deeper: what the neighbourhood structure of the entire space looks like — which collections of points form coherent open regions, and how those regions combine.

    The construction follows a method introduced by Nada, El Atik, and Atef in 2018. For each vertex v in the graph, you form its closed neighbourhood — the vertex itself plus all its direct neighbours. This family of closed neighbourhoods serves as a subbase. You then close it under finite intersections to obtain a base, and close the base under arbitrary unions to obtain the full topology.

    If those words feel heavy, think of it this way: the subbase is a rough draft of “who belongs with whom.” Intersecting neighbourhoods refines the draft — “the points that both neighbourhoods agree on.” Taking unions completes the picture — “every region that can be assembled from these building blocks.” The result is a genuine topological space, complete with open sets satisfying the standard axioms, sitting on top of your time series like a scaffolding you didn’t know was there.

    Step 3: The Topology Reveals Its Connectivity

    Now comes the decisive question. A topological space is connected if it cannot be split into two non-empty open pieces — if there is no clean fracture running through it. For finite spaces, there is a beautiful theorem, due to McCord (1966) and Stong (1966), that makes this check exact and tractable. The specialization preorder orders the points by how their neighbourhoods nest inside one another, and the connected components of the resulting structure are precisely the topological connected components.

    The crucial practical point: this computation works directly on the base — the refined building blocks — without ever needing to enumerate the full topology (which can be exponentially large). It runs in polynomial time, and the components it returns are exact, not approximate.


    The Decision Rule

    Everything so far converges on a single, actionable verdict. topologyR hands you a connectedness decision, and that decision has a direct methodological consequence:

    • If the induced topology is connected, then your data are consistent with a single continuous process. Global continuous methods — splines, kriging, polynomial interpolation, moving-average imputation, kernel methods — are mathematically supported. You may proceed.
    • If the induced topology is disconnected, then no single continuous function can cover the entire series. Global continuous methods are invalid by construction. You must segment the series along the connected components the package identifies, and model each piece independently — with regime-switching models, component-wise imputation, or finite mixtures.

    This is the package’s value proposition: a reproducible, topology-first workflow that decides, before you touch a model, whether global continuity is a justified assumption or a silent error.

    Global versus Local

    A subtlety worth flagging: the rule depends on what you are trying to learn. Global properties — a secular trend, a Hurst exponent, total neural synchronisation, a centennial warming signal — depend on relationships among all points and require topological connectivity to be valid. Local properties — instantaneous volatility in a small window, point-to-point rates of change, low-order autocorrelation — are defined on restricted neighbourhoods and remain valid within each connected component, regardless of whether the whole series is one piece or several. The package gives you the component structure to make that distinction operational.


    Time Has an Arrow: Directed Topologies and Irreversibility

    So far, the construction has treated the visibility graph as undirected — time flows, but the edges don’t care which way. That discards information. Time series are inherently directional: time runs from past to future, and many real systems are irreversible — they behave differently forwards and backwards. Economic expansions creep upward over years; recessions collapse in quarters. Neurons fire and recover on different timescales. The undirected graph cannot see this asymmetry.

    topologyR’s directed mode fixes this. With directed = TRUE, each visibility edge is oriented from the earlier time point to the later one, producing a directed acyclic graph (a DAG) in which the time index is a natural topological order. From this directed graph, the package extracts two neighbourhood structures: the forward neighbourhood (who can I see ahead of me?) and the backward neighbourhood (who behind me can see me?).

    Applying the Nada construction to each yields two topologies: a forward topology τ⁺ and a backward topology τ⁻. The pair (X, τ⁺, τ⁻) forms what Kelly (1963) called a bitopological space — a set equipped with two topologies rather than one. The divergence between them is a direct, topological measurement of temporal irreversibility.

    Irreversibility Indices

    In a perfectly reversible process — symmetric dynamics, no privileged direction — the two topologies coincide: τ⁺ ≅ τ⁻. They have the same number of connected components, the same base size, the same connectivity. In an irreversible process, they pull apart.

    topologyR quantifies this with several indices. The component irreversibility measures the normalised difference in the number of connected components between the forward and backward topologies: zero means symmetric, one means maximally asymmetric. The base irreversibility does the same for the sizes of the topological bases. The asymmetry direction — the signed difference in component counts — tells you which way the arrow points: a positive value means the forward topology is more connected (fewer components) than the backward one.

    That last point has a concrete physical interpretation. Consider a time series with gradual expansions and abrupt contractions — the classic shape of a business cycle, where GDP creeps up over years and drops in a quarter. During a gradual rise, forward visibility is relatively unobstructed: looking ahead from a point on the upslope, you can see far. After an abrupt drop, backward visibility is blocked: looking back from the trough, the cliff face hides earlier points. This asymmetry means the forward topology should be more connected than the backward topology — fewer forward components, more backward fragmentation. The package predicts, and the data confirm, a positive asymmetry direction for such series.


    The Alexandrov Layer and the Resolution Hierarchy

    There is a third topology lurking in the directed graph, and it is older than the Nada construction by several decades. The Alexandrov topology τ_A, introduced by Alexandrov in 1937, is the topology whose open sets are the upsets of the reachability relation — the sets that, once you enter them, contain everything reachable downstream. For each vertex, its minimal open set is the collection of all vertices reachable from it via directed paths.

    topologyR computes this efficiently: a reverse-order bitset propagation that processes vertices from last to first, OR-ing reachability sets together in O(nm/64) time, reusing the same high-performance bitset infrastructure as the Nada engine.

    The relationship between the Alexandrov and Nada topologies is precise and informative: τ_A is always a subset of the forward Nada topology. The Alexandrov base captures pure order structure — “who can reach whom” — while the Nada intersection closure generates additional sets that are not upsets, catching finer-grained structure. The difference in base sizes, |B_Nada| − |B_A|, tells you exactly how much extra topological information the Nada pipeline extracts beyond the raw ordering. A large gap means the closure operations are doing real work; a small gap means the order structure already tells most of the story.


    Under the Hood: Performance Without Compromise

    Topological enumeration is, in the worst case, exponential — the number of open sets can in principle double with every additional element. This is an inherent mathematical fact, not a software limitation. But topologyR is engineered so that the decision you actually need — connectedness — never requires that enumeration.

    The connectivity computation works on the base alone, via the specialization preorder, in O(n² · ⌈B/64⌉) time. The C++ backend (via Rcpp) represents every subset as a packed array of 64-bit words, so set operations reduce to machine-level bitwise instructions. A compile-time template dispatch selects single-word operations for series up to 64 points, two-word for up to 128, three-word for up to 192 — zero loop overhead, branch-free. Beyond that, a runtime fallback handles arbitrary sample sizes, and OpenMP parallelisation is available where the build supports it.

    The practical upshot: you can run the connectivity decision on series with thousands of points without ever touching the exponential regime. Safety limits (max_base_sets, max_open_sets) cap the intersection and union closures with informative termination flags, so if a computation does hit resource limits, you know exactly where and why — and the connectivity result remains valid as long as the base closure completes.


    A Real-World Test: Reading the Business Cycle

    The paper accompanying the package applies the framework to quarterly U.S. real GDP growth from 1992 to 2024 — 129 observations spanning over three decades. The bitopological analysis recovers a positive asymmetry direction: the forward topology is more connected than the backward one, exactly as predicted for a series with gradual expansions and abrupt contractions.

    The undirected topology partitions the series into six connected components, each corresponding to a distinct macroeconomic regime. Strikingly, the COVID-19 contraction and its rebound — the deepest and fastest swing in the sample — are classified as a single topological episode: one connected component spanning the collapse and recovery, reflecting the fact that the visibility structure treats the V-shaped episode as one structural unit rather than two separate events.

    This is the kind of insight the package is designed to produce: not a forecast, not a parameter estimate, but a structural classification that tells you where the legitimate boundaries in your data lie — and, critically, whether a global model is appropriate at all.


    Where It Sits: Complementary, Not Competing

    It is important to be clear about what topologyR is not. It is not a general-purpose topological data analysis (TDA) engine. Packages like GUDHI, Ripser, TDAstats, and scikit-TDA compute persistent homology — multi-scale features across all dimensions, capturing higher-order structures (loops, voids) via Betti numbers β₁, β₂ and their persistence across scales. That is a richer and harder enterprise.

    topologyR has a narrower and more focused aim: it zeroes in on β₀ — connectedness — for one-dimensional series, using graph-induced topologies, and it turns that single invariant into an actionable decision rule for method selection. Think of it as a pre-model governance tool: a rigorous gatekeeper that runs before you choose your modelling strategy, telling you whether the continuity assumptions your favourite methods require are actually justified by the data’s structure.

    The two approaches are complementary. For early-warning detection, precursor signals, or multi-channel structure, persistent homology is the right tool. For the binary question “can I legitimately fit a global continuous model to this series?”, topologyR gives a direct, interpretable, and mathematically exact answer. A natural hybrid workflow uses topologyR as a pre-test and persistent homology for deeper multi-scale analysis.


    Honest Limitations

    No tool is universal, and topologyR is transparent about its boundaries:

    1. Graph choice matters. HVG and NVG produce different graphs, and therefore potentially different topologies. The NVG, being denser, tends to produce fewer connected components. The package encourages comparing both and interpreting the difference — the gap itself is diagnostic.
    2. Sampling and noise. Sparse sampling can mimic disconnection; minor overlaps can mimic connection. The connectedness verdict should be treated as prima facie evidence, not absolute truth — especially near the boundary.
    3. β₀ only. The approach focuses on connectedness. It will not capture loops, voids, or higher-order patterns that persistent homology can detect. If your question is about cycles or multi-scale structure rather than fragmentation, you need the heavier machinery.
    4. Enumeration is exponential; connectivity is not. This is handled honestly: the connectivity decision is polynomial and scalable; full topology enumeration (needed for pairwise connectedness in the bitopological sense) is capped by safety limits with transparent reporting.

    The Bigger Picture

    What makes topologyR more than a clever technical exercise is its epistemological stance. It transforms a step that is normally a tacit habit — assuming continuity — into an explicit, testable, mathematical procedure. In doing so, it removes arbitrariness from one of the most consequential decisions in applied quantitative work: the choice between global and segmented methods.

    The package’s central theorem — that the Nada construction extends to directed graphs and yields a bitopological space whose asymmetry quantifies irreversibility — is formalised in Lean 4 against Mathlib, so the mathematical foundation is not merely asserted but machine-checked. The implementation is CRAN-compliant, passes R CMD check --as-cran cleanly, and ships with 68 unit tests covering visibility graphs, topology generation, connectivity, directed topology, Alexandrov topology, and bitopological analysis.

    For anyone who works with time series and has ever fitted a spline, run a kriging model, or estimated a trend — which is to say, for most of applied quantitative science — topologyR offers something rare: a way to check, before you model, whether the smoothness you are about to assume is a property of your data or a story you are telling yourself.


    Links and Credits

    The package is authored by José Mauricio Gómez Julián and released under the MIT licence. It requires R ≥ 4.0.0 with Rcpp and ggplot2. The companion paper, “Bitopological Spaces from Directed Graphs: Extending the Nada Construction to Capture Temporal Irreversibility,” develops the full mathematical theory, including the central theorem, the Alexandrov sublayer, specialization preorder, pairwise connectedness, polynomial-time algorithms, and the Lean 4 formalisation.

    If you use topologyR in your research, please cite the repository release.

  • Discovering the Equations Behind Your Data: A Look at EmpiricalDynamics library in R

    Discovering the Equations Behind Your Data: A Look at EmpiricalDynamics library in R

    You can also find this library at CRAN and download it directly from R and RStudio.

    Nonlinear Dynamics · Symbolic Regression · ODE · SDE

    What Equation Is Hiding in the Data? An Introduction to EmpiricalDynamics

    An R package for discovering and evaluating differential equations directly from time series, combining robust numerical differentiation, symbolic regression, stochastic modelling, temporal validation, and a high-performance Julia backend.

    EmpiricalDynamics · R · Julia · SymbolicRegression.jl · development version 0.1.13 · developed by José Mauricio Gómez Julián · GitHub

    Project status — August 2026. The main GitHub branch is currently at version 0.1.13 and declares GPL (≥ 3). The version currently published on CRAN is 0.1.9, which predates that licensing change.

    We have a time series: a country’s GDP, a biological population, a temperature record, an interest rate, the concentration of a substance, or the reading of a sensor. We suspect that some dynamical law lies behind its motion. The problem is that we do not know what that law is.

    One strategy is to choose an equation in advance and estimate its parameters. This is the familiar approach: assume linear, logistic, exponential, or some other known dynamics and ask which parameter values best fit the data.

    EmpiricalDynamics also allows us to ask the inverse question: what functional form can the algorithm itself discover from the observed dynamics?

    Instead of restricting the problem from the outset to \(\dot Z=\alpha+\beta Z\), a symbolic search can explore combinations of variables and mathematical operations, generate competing candidate equations, and compare their fit against their complexity.

    The fundamental idea

    The goal is not merely to predict the next observation with a black box. It is to recover an interpretable mathematical expression describing the observed dynamics and then subject that expression to diagnostics, simulations, and behavioural checks.

    From estimating parameters to discovering equations

    Suppose we already know the functional form:

    \[ \frac{dZ}{dt} = \alpha+\beta Z. \]

    Then the problem is essentially to estimate \(\alpha\) and \(\beta\).

    Equation discovery poses a broader problem:

    \[ \frac{dZ}{dt} = f(Z,\mathbf X;\boldsymbol{\theta}), \]

    where we observe \(Z\) and possibly a set of exogenous variables \(\mathbf X\), but the function \(f(\cdot)\) itself is also unknown.

    The algorithm must search simultaneously for a functional structure and its constants.

    When the system is stochastic

    Many real systems do not evolve according to a perfectly deterministic law. Even after discovering a systematic structure, a random component may remain whose intensity depends on the state of the system itself.

    The natural description then moves from an ODE to a stochastic differential equation:

    \[ dZ_t = f(Z_t,\mathbf X_t)\,dt + g(Z_t,\mathbf X_t)\,dW_t. \]

    Here \(f\) is the drift: the systematic dynamics. \(g\) is the diffusion: the intensity of the stochastic component. \(W_t\) denotes a Wiener process.

    Discovering an SDE therefore means solving two distinct problems: recovering the drift law and recovering the structure of the diffusion.

    The architecture: six auditable stages

    Preprocessing. Estimate numerical derivatives from potentially noisy observations.

    Exploration. Examine relationships, phase portraits, surfaces, and possible nonlinearities before fitting.

    Symbolic discovery. Search for candidate equations and construct a frontier trading goodness of fit against complexity.

    Residual analysis. Ask what structure remains unexplained and, when appropriate, construct the diffusion term of an SDE.

    Validation. Use time-aware cross-validation, trajectory simulation, and qualitative analysis of the dynamics.

    Output. Produce LaTeX equations, tables, figures, and reports suitable for documentation or publication.

    The first bottleneck: estimating a derivative without amplifying noise

    To discover \[ \dot Z=f(Z,X) \] we first need an estimate of \(\dot Z\).

    But numerical differentiation of noisy observations is dangerous: differentiation amplifies precisely the high-frequency fluctuations that we often want to treat as measurement noise.

    EmpiricalDynamics provides several alternatives.

    Method Idea Natural use case
    TVR Regularizes the total variation of the derivative. Noisy data, trends, and possible discontinuities.
    Savitzky–Golay Uses local polynomial fits. Relatively smooth signals where preserving peaks matters.
    Smoothing spline Smooths the series continuously before differentiating. Smooth processes observed with noise.
    Finite differences Uses direct local numerical approximations. Clean, sufficiently dense observations.
    Spectral Differentiates in the frequency domain. Periodic signals; requires care with Gibbs phenomena.

    TVR: smoothing the derivative without erasing all the structure

    The method recommended by the documentation for many empirical applications is Total Variation Regularization.

    Schematically, it seeks:

    \[ \widehat{\dot Z} = \arg\min_{\dot Z} \left\| Z-\int_0^t \dot Z(\tau)\,d\tau \right\|_2^2 + \lambda \left\| \Delta\dot Z \right\|_1. \]

    The first term forces the estimated derivative to reconstruct the observed series adequately. The second penalizes an excessively irregular derivative.

    The current implementation internally rescales the optimization problem to improve numerical conditioning and uses a cascade of solvers:

    1. CLARABEL

    Currently the preferred TVR solver and the first option in the solver cascade.

    2. SCS

    Provides an alternative algorithmic family when the first solver does not achieve the desired status.

    3. OSQP

    Acts as a third optimization route when the preceding alternatives do not provide a satisfactory solution.

    Selecting \(\lambda\)

    select_lambda_cv_tvr() can automatically evaluate a grid of candidate values while reporting solver-convergence status.

    The internal SDE paradox: a better drift can destroy the evidence for diffusion

    This is perhaps the most interesting statistical idea in the package’s design.

    TVR improves drift estimation precisely by smoothing. But the diffusion component of an SDE manifests itself to a large extent through high-frequency fluctuations.

    If we then use the residuals of a strongly regularized derivative to recover \(g\), we may already have removed much of the information that we were trying to measure.

    The conflict

    TVR wants to clean high-frequency variation in order to estimate the drift. Diffusion lives precisely in that high-frequency variation. A method that improves the first task can therefore damage the second.

    The solution: estimate diffusion from quadratic variation

    When TVR is used, the current implementation recommends recovering diffusion not from TVR residuals but by returning to the observed increments themselves.

    For an SDE:

    \[ \frac{(\Delta Z)^2}{\Delta t} \approx g^2(X) + O(\Delta t). \]

    estimate_diffusion_qv() uses this quadratic-variation relationship.

    The estimate of \(g\) therefore no longer depends on residuals that TVR has already smoothed.

    Individual values of \((\Delta Z)^2/\Delta t\) are naturally very noisy, so the procedure internally applies a rolling-median smoother before fitting the functional relationship.

    The recovery tests reveal the problem directly

    Historical configuration Drift \(R^2\) Diffusion \(R^2\)
    Earlier solver + residual-based diffusion 0.864 0.591
    Rescaled OSQP + residuals 0.887 0.070
    Rescaled CLARABEL + residuals 0.841 0.005
    CLARABEL + quadratic variation 0.841 0.985

    The point is not that a “worse” solver happened to be better. It is exactly the opposite: as derivative estimation became more effective at removing high-frequency fluctuation, a diffusion estimate based on those residuals lost the signal it needed.

    Returning to the raw increments allows the two problems to be decoupled.

    The heart of the package: symbolic regression

    Once the derivative has been estimated, the algorithm can search for expressions capable of explaining its behaviour.

    Rather than optimizing constants alone, the search also changes the structure of the expressions themselves:

    \[ Z,\quad Z^2,\quad XZ,\quad \sin(X),\quad e^Z,\quad \frac{X}{Z},\quad \ldots \]

    The result should not be interpreted simply as “the equation with the smallest error.”

    EmpiricalDynamics constructs a Pareto frontier containing equations that embody different trade-offs between fit and complexity.

    Available criteria for choosing among candidates include AIC, BIC, and MDL, along with selection mechanisms operating directly on the frontier.

    search_result <- symbolic_search(
      data = data,
      response = "dZ",
      predictors = c("Z", "X"),
      backend = "r_genetic",
      max_complexity = 15,
      n_generations = 50,
      population_size = 100,
      n_runs = 3
    )
    
    plot_pareto_front(search_result)
    
    best_eq <- select_equation(
      search_result,
      criterion = "bic"
    )

    If theory already gives you a form, there is no prize for ignoring it

    The package does not present blind symbolic search as superior in every situation.

    If theory supplies a specific functional form, the documentation recommends fitting that form directly with fit_specified_equation().

    equation <- fit_specified_equation(
      "alpha + beta * Z + gamma * Z^2 + delta * X",
      data = data,
      derivative_col = "dZ",
      method = "levenberg-marquardt",
      start = list(
        alpha = 0,
        beta = 1,
        gamma = -0.01,
        delta = 0.5
      )
    )

    This is an important methodological distinction: discovery when we do not know the structure; direct estimation when we already have a structural hypothesis that we want to test.

    Explore before you search

    explore_dynamics() allows the user to inspect relationships visually before launching a symbolic search.

    It currently compares linear, quadratic, and cubic forms for predictors, retaining the winning fit, its coefficients, the range over which it was estimated, and the AIC values of the competing models.

    This matters because a label such as “quadratic” does not tell us whether the fitted curve actually changes direction within the observed range.

    A current caution

    The Wiki itself reports that, in internal simulations, this AIC comparison classifies a truly linear relationship as “linear” only about 78% of the time. The label should therefore be read as model selection, not as infallible measurement of the true functional form.

    Julia handles the heavy evolutionary search

    The high-performance backend uses SymbolicRegression.jl.

    The architecture keeps the statistical workflow, diagnostics, and user interface on the R side, while Julia can handle the more expensive, parallelizable evolutionary searches.

    The file inst/julia/symbolic_backend.jl defines a scientific-search configuration controlling, among other things:

    • population size;
    • number of iterations;
    • maximum complexity;
    • parsimony penalties;
    • allowed operators;
    • checkpoints;
    • and detection of selected physical constants.

    The current backend recognizes \(\pi\), \(e\), \(\varphi\), \(g\), \(c\), \(h\), and \(k_B\) as candidate constants, including several simple transformations of them.

    This makes it possible, for example, to recognize that a discovered numerical coefficient lies close to \(\pi\), rather than reporting only a decimal expansion with no interpretation.

    Iterative GLS: the current version preserves the full fitting history

    When conditional variance changes with the state, the package can refine the drift through an iterative GLS procedure.

    Schematically:

    \[ r_i^{(k)} = \dot Z_i – \widehat f^{(k-1)}(Z_i,X_i), \]
    \[ w_i^{(k)} = \frac{1} {\widehat g^{(k)}(Z_i,X_i)^2}, \]

    and those weights modify the next drift estimate.

    Recent versions corrected a fundamental detail: the previous loop could fail to recognize its own convergence when constants in a symbolic equation appeared as numeric literals.

    The current implementation requires both:

    Objective stability

    Weighted deviance must have stopped changing materially.

    Functional stability

    Predictions from two successive iterations must also have become sufficiently close.

    The result also preserves converged, stop_reason, history, selected_iteration, selection scores, and excluded candidates.

    By default, iteration selection uses blocked cross-validation with contiguous blocks and refitting of the constants.

    Residuals are a question, not a wastebasket

    After fitting an equation, whatever remains unexplained may contain information about model misspecification or unresolved stochastic structure.

    residual_diagnostics() brings several tests together:

    Test What it examines
    Ljung–Box Remaining serial dependence.
    ARCH-LM Conditional heteroskedasticity.
    Breusch–Pagan Variance related to predictors.
    Jarque–Bera Departures from normality.
    Runs test Remaining non-random patterns.

    Validating a temporal equation without letting it look into the future

    A time series should not be validated as though its rows were interchangeable.

    The current implementation supports block validation and rolling or sliding schemes. In rolling mode, observations used for training occur before the test window.

    cv <- cross_validate(
      equation,
      data = data,
      response = "dZ",
      k = 5,
      method = "rolling",
      horizon = 4,
      window = "expanding"
    )

    This sounds obvious, but it was not true in earlier versions. Version 0.1.12 corrected a defect in which the rolling implementation could use observations occurring after the window it was supposed to validate.

    Other issues were also corrected:

    • blocks now cover all rows instead of dropping trailing observations;
    • \(R^2\) is evaluated against the training-set mean rather than a mean computed after observing the test data;
    • folds whose refit fails no longer silently disappear from the average;
    • observation weights are preserved when each fold is refitted;
    • a GLM is refitted as a GLM rather than accidentally reverting to an ordinary Gaussian regression.

    An important limitation of that cross-validation

    There is still a subtlety that the current documentation makes explicit.

    When the response variable is a numerically estimated derivative, \(\dot Z_t\) itself may have been constructed using neighbouring observations.

    With TVR, information from the entire series may even enter the derivative estimate.

    Therefore, although the model in each rolling fold is not fitted using future observations under the corrected scheme, the derivative supplied to that model may previously have been calculated using such information.

    What the CV means, then

    The documentation explicitly warns that these scores can be used to compare candidate equations under the same preprocessing regime, but they should not be interpreted as the forecasting error we would expect on a completely new future series. The option intended to recompute the derivative within every fold, refit_derivative, is not yet implemented.

    An equation must do more than fit points: it should behave correctly

    EmpiricalDynamics includes tools for studying qualitative properties of a discovered equation:

    • fixed points;
    • stability;
    • bifurcations;
    • boundedness;
    • and full trajectory simulation.

    This is an important difference between finding a flexible regression and recovering a plausible dynamical system.

    Two expressions can have similar errors on the observed sample and still generate completely different dynamical portraits when integrated.

    Bayesian bifurcations: a recent improvement

    Version 0.1.11 substantially hardened analyze_bifurcations().

    For models containing posterior draws, the function no longer automatically collapses all uncertainty into a single coefficient vector. It can sweep over the posterior distribution and return distributions of fixed points.

    It also checks whether changing the bifurcation parameter actually changes the object’s predictions.

    This prevents the function from producing a perfectly formatted but scientifically empty table in which every value of the bifurcation parameter gives exactly the same result because the substitution never reached the prediction mechanism.

    Version 0.1.13 also added ed_derivative_step(), which officially exposes the \(10^{-6}\) central-difference step used in fixed-point classification.

    Recovery tests: giving the algorithm a world whose law we already know

    The most direct way to validate an equation-discovery algorithm is to construct a synthetic world in which the true law is known, hide that law from the algorithm, and ask whether it can recover it.

    This does not prove causality in real observational data.

    It does answer an indispensable prior question: if the true law is present in the data under controlled conditions, can the pipeline actually find it?

    The Lorenz attractor

    One benchmark uses the classical chaotic system:

    \[ \frac{dx}{dt}=10(y-x), \]
    \[ \frac{dy}{dt}=28x-xz-y, \]
    \[ \frac{dz}{dt}=xy-\frac{8}{3}z. \]
    Equation \(R^2\) against the true dynamics
    \(dx/dt\) 0.937
    \(dy/dt\) 0.960
    \(dz/dt\) 0.914
    Average 0.937

    The Wiki notes that these figures combine TVR differentiation error with symbolic-regression error, and that the evolutionary search itself is stochastic: different runs can return somewhat different results.

    The stochastic benchmark

    The second recovery test uses a deliberately challenging SDE:

    \[ dZ_t = \left[ 10\sin(X_t)-2.5Z_t^3 \right]dt + \left[ 0.10+0.06|X_t| \right]dW_t. \]

    With 5,000 observations, \(\Delta t=0.005\), and a documented SNR of approximately \(0.29\), the reported results are:

    Component \(R^2\) RMSE Procedure
    Drift 0.841 0.547 TVR + iterative GLS
    Diffusion 0.985 0.063 Quadratic variation
    How to read these benchmarks

    These are recovery tests on synthetic systems with known ground truth. They show that the pipeline can recover those structures under the conditions tested. They do not guarantee that an equation discovered from observational data is the true causal law of the system.

    Discovering an equation is not the same as discovering causality

    This boundary matters.

    A symbolic expression can reproduce an observed relationship extremely well and still reflect omitted variables, confounding, simultaneity, measurement error, or a structure that works only within a particular regime.

    Symbolic regression primarily answers: what mathematical structure is consistent with the observed dynamics?

    Turning that structure into a causal claim requires additional information and reasoning.

    Installation: CRAN or the development version

    The version published on CRAN can be installed directly:

    install.packages("EmpiricalDynamics")

    To use the latest state of the repository:

    remotes::install_github(
      "IsadoreNabi/EmpiricalDynamics"
    )

    The Julia backend can then be configured from R:

    library(EmpiricalDynamics)
    
    setup_julia_backend()

    The package metadata currently declares R 4.0.0 or later and Julia 1.6 or later as the system requirement for the backend. The README currently recommends Julia 1.9 or later; using a recent Julia release satisfies both specifications.

    The deeper methodological point

    The temptation in equation discovery is to imagine a machine that receives a table and returns “the law of nature.”

    EmpiricalDynamics becomes more interesting when understood in a different way.

    Symbolic search is only one part of a much longer procedure.

    First, we need a defensible derivative estimate. Then we explore the geometry of the relationship. Next, we search for or specify candidate equations. After that, we examine what remains in the residuals. If stochastic structure is present, drift and diffusion must be separated. Then we examine qualitative behaviour and simulate trajectories. Finally, we ask how much of the conclusion survives outside the immediate fit.

    And every one of those steps can fail in a different way.

    That is the most interesting contribution of EmpiricalDynamics: it does not treat equation discovery as a competition in which the expression with the highest \(R^2\) automatically wins. Instead, it treats it as a complete problem of dynamical inference. The equation should be parsimonious, survive diagnostics, reproduce qualitative properties, and correctly separate deterministic from stochastic structure. Its recovery tests show that the pipeline can rediscover known dynamics; its recent revisions show something equally important: when a metric, validation scheme, or bifurcation sweep did not mean exactly what it claimed to mean, the behaviour was audited and corrected. The final product is not simply a formula found by a computer. It is a more disciplined way of asking: what equation is genuinely consistent with the dynamics we observe, and what evidence do we have for believing it?

    EmpiricalDynamics is developed by José Mauricio Gómez Julián. The current development branch declares GPL (≥ 3). The source code and change history are available on GitHub, while the mathematical documentation, recovery tests, and usage guides are available in the EmpiricalDynamics Wiki.

  • Quasi-Newton methods in optimization

    Consider the unconstrained minimization problem where is twice differentiable and . Newton’s method is a second-order descent method for finding the minimum. Starting at some initial point, at the th iteration we update the candidate solution with the formula where and are the gradient and Hessian of respectively, and is a step size chosen appropriately […]

    Quasi-Newton methods in optimization
  • What are the KKT conditions?

    Consider an optimization problem in standard form: with the variable . Assume that the ‘s and ‘s are differentiable. (At this point, we are not assuming anything about their convexity.) As before, define the Lagrangian as the function Let and be the primal and dual optimal points respectively (i.e. points where the primal and dual […]

    What are the KKT conditions?