
You can also find this library at CRAN and download it directly from R and RStudio.
LISTEN TO THIS POST AS A PODCAST:
The problem hiding in your data
Picture a straightforward question: Is the average inflation rate in the United States meaningfully different from zero? You have monthly data going back decades. A classical t-test would seem like the natural tool — and it would be quietly, systematically wrong.
The reason is that inflation figures do not bounce around independently. January’s number carries information about February’s. This autocorrelation corrupts the standard error that the t-test relies on, inflating the false-positive rate well beyond the nominal 5% you think you are signing up for. The same problem afflicts yield spreads, stock returns, sectoral profitability, regional employment — virtually any real-world time series you might want to compare.
Now make it harder. The two groups you are comparing have different sample sizes — one sector has twenty years of data, another only five. The data may have heavy tails you cannot rule out. And your sample is finite, which means the asymptotic guarantees printed in your econometrics textbook are promises that may not have been kept yet.
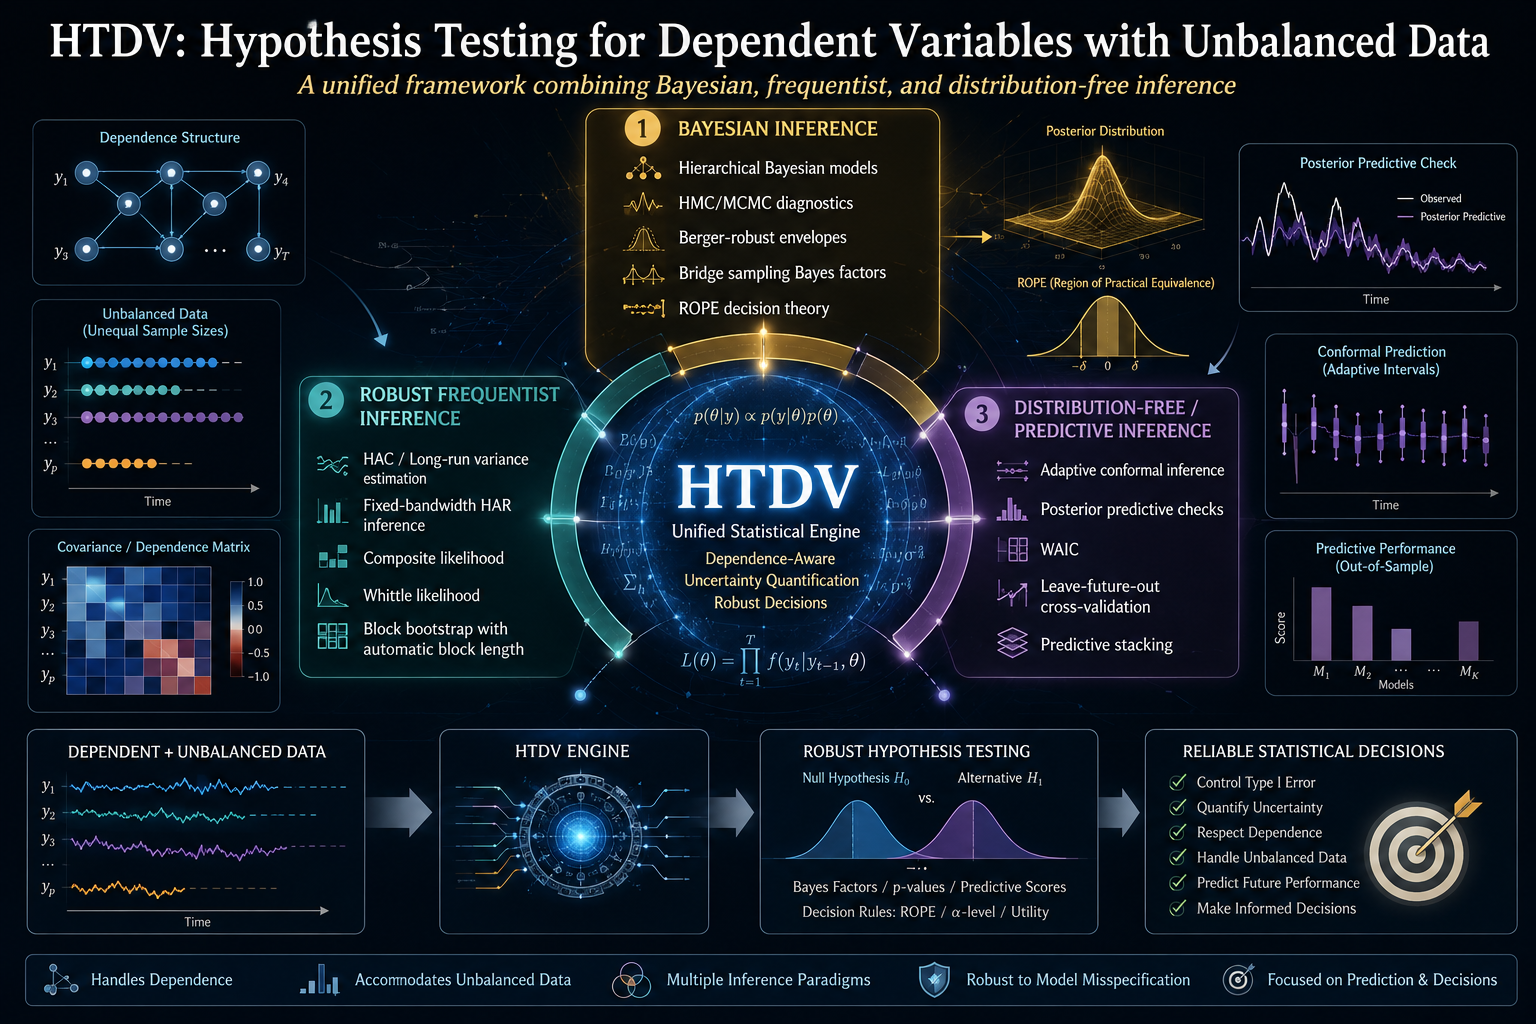
This is the terrain HTDV was built for. Short for Hypothesis Testing for Dependent Variables with Unbalanced Data, HTDV is an R package that answers a deceptively simple question — do these dependent, possibly unequally-sized samples come from the same population? — under the worst combination of conditions an applied statistician is likely to encounter.
The central idea: triangulation, not trust
The most common approach to dependent data is to reach for a single robust method — a heteroskedasticity-and-autocorrelation-consistent (HAC) standard error, say, or a block bootstrap — and hope it is calibrated. HTDV takes a structurally different stance: run three independent inferential methods in parallel and expose the disagreement between them as a signal.
The three layers are:
- A hierarchical Bayesian fit via Hamiltonian Monte Carlo (HMC), implemented in Stan. This layer builds a full probability model of the data-generating process, places weakly informative priors on the dependence parameters, and produces a posterior distribution for the quantity of interest.
- A fixed-bandwidth HAR Wald test in the frequentist tradition of Kiefer and Vogelsang (2005). Rather than letting the bandwidth grow with the sample in the usual way, it holds the bandwidth at a fixed fraction of the sample size. This produces a non-standard asymptotic distribution that is better calibrated in finite samples than the conventional chi-square approximation.
- A stationary block bootstrap (Politis and Romano, 1994) with automatic block-length selection (Patton, Politis, and White, 2009). This resamples the data in blocks long enough to preserve the dependence structure, then constructs confidence intervals from the resampled distribution.
A fourth, distribution-free layer — adaptive conformal inference (Gibbs and Candès, 2021) — is available for online prediction settings where no parametric assumption is palatable.
The logic is forensic. Where all three layers agree, your conclusion is robust. Where they disagree, the pattern of disagreement tells you something specific about your data. If the Bayesian interval is dramatically wider than the HAR or bootstrap interval, your series likely has strong temporal persistence, and the asymptotic critical values that HAR and bootstrap rely on are losing their reliability. That gap is not a bug — it is the most informative thing the framework can show you.
Why a single method is not enough
It is fair to ask: if the Bayesian layer is the most reliable, why not just use it and discard the others? The answer is that each layer has a regime where it is the appropriate tool, and the framework’s job is to make the regime visible.
HAR inference is computationally cheap — sub-second on typical data — and well-calibrated when persistence is low to moderate and sample sizes are large enough for asymptotics to bite. The block bootstrap shares those advantages while making fewer distributional assumptions. The Bayesian layer is the most computationally expensive (each fit can take tens of seconds) but is the only one that maintains nominal calibration under strong persistence at finite sample sizes, because it models the dependence explicitly rather than relying on asymptotic corrections.
The package ships with a pre-registered factorial Monte Carlo study — 1,024 cells crossing sample size, autocorrelation, tail heaviness, imbalance ratio, and location shift, with 500 replications per cell across all three inferential layers — and the results are unambiguous. The Bayesian layer holds nominal size (mean 0.056 against a target of 0.05) and nominal coverage (mean 0.944 against a target of 0.95) across the entire grid. HAR and bootstrap, by contrast, inflate dramatically in the worst corners: under strong persistence and small samples, HAR’s empirical rejection rate under the null reaches 0.60, and its coverage drops to 0.29.
The narrowness of the HAR and bootstrap intervals in those corners is not a sign of precision. It is a sign of miscalibration — the intervals are confidently wrong.
The theory that holds it together
Running three different methods on the same data and comparing the answers is sound practice, but it raises a mathematical question: under what conditions are the three methods even addressing the same inferential target? A Bayesian posterior on a triangular-array likelihood and a HAR-Wald statistic on a mixingale process are, on their face, different objects.
HTDV’s theoretical backbone is a metric equivalence theorem that resolves this concern. The framework identifies three structurally distinct ways real-world data can violate the independence assumption — each corresponding to a different law-of-large-numbers regime:
- Triangular Arrays Convergence (TAC): information accumulates through hierarchical aggregation. Think of input-output tables disaggregated into ever-finer sectors, where each “row” of the array adds more observations.
- Weighted Sums with Correlation (WSC): the observations share a cross-sectional covariance structure. Regional markets that move together, trade flows between linked economies.
- Mixingale Process Convergence (MPC): temporal memory that decays smoothly over time. Forecast errors, model residuals, prediction intervals that gradually lose contact with the past.
The theorem proves that, under α-mixing with polynomial decay rate γ > 1 and finite moment conditions, these three regimes induce strictly equivalent metrics on the space of hypothesis-testing problems. The equivalence comes with explicit, computable finite-sample constants — exposed by the function htdv_equivalence_constants() — that tell you the maximum slack when translating a conclusion from one regime to another. For typical parameter values (γ = 2, q = 6, n = 500), the conversion slack is about 18%, a margin that is usually irrelevant for a hypothesis-testing decision.
This is what makes the three-layer architecture mathematically well-defined rather than merely pragmatic. Without the equivalence theorem, comparing a Bayesian result on a TAC dataset with a HAR result on a WSC dataset would be comparing apples and oranges. The theorem certifies that the metrics are coercible to one another with computable error.
The dependence assumption, plainly
The framework assumes that the data are α-mixing with polynomial decay — meaning that the statistical dependence between observations dies off as they get farther apart in time, and it does so fast enough (at a rate faster than 1/k) that the long-range correlations are summable. This is a mild condition satisfied by most stationary time series in econometrics and finance, including ARMA processes, GARCH models, and a broad class of Markov chains.
It is not satisfied by long-memory processes (where dependence decays more slowly than 1/k) or by unit-root processes (where dependence does not decay at all). The framework is honest about these limitations: it will fit near-unit-root data, but the posterior will widen correspondingly — which is the correct answer. For explicit unit-root testing, the standard ADF or Phillips-Perron tools remain the right choice.
The Bayesian engine
The hierarchical Bayesian core fits Stan models via the No-U-Turn Sampler (NUTS), the state-of-the-art Hamiltonian Monte Carlo variant. The models are parameterized around an AR(1) structure — the mean θ, the autocorrelation φ, and the innovation scale σ — with hierarchical priors on the dependence nuisance parameters that are weakly informative enough to respect admissible ranges without overwhelming the data.
Five likelihood backends are available, corresponding to the three convergence regimes plus two parametric likelihood families: the Whittle likelihood (which works in the frequency domain, comparing the observed periodogram to a theoretical spectral density) and the composite likelihood (which works in the time domain, combining conditional densities over short blocks). Both are well-established in the time-series literature; the choice between them depends on whether you have more confidence in your spectral model or your conditional density model.
A distinctive feature is the Berger-robust envelope — a method for combining posteriors across multiple fitted models into a single, wider posterior that hedges against the worst-likelihood-specification scenario. If you are unsure whether the Whittle or composite likelihood better describes your data, the envelope gives you an inferential answer that is honest about that uncertainty rather than forcing an arbitrary choice.
After sampling, every fit must pass a five-gate diagnostic check before its posterior is admissible: split-R̂ below 1.01, bulk and tail effective sample sizes above 400, zero post-warmup divergences, and energy Bayesian fraction of missing information (E-BFMI) above 0.3. These are the standard HMC convergence diagnostics from the Stan ecosystem, enforced as a gate rather than offered as a suggestion.
The validation: visible in the data
The most compelling aspect of HTDV is that it does not merely claim to be well-calibrated — it ships the evidence. Two validation datasets are bundled with the package.
The first is the factorial simulation described above, with its 3,069-row summary table accessible as a package dataset. The headline finding — that the Bayesian layer is the only one maintaining nominal calibration across the full design — is not an assertion but a reproducible fact. The full study took 31 hours on a 16-core workstation; the scripts to regenerate it from scratch are shipped in the package repository.
The second is a set of three external benchmarks against published references on public-source data:
- Post-1984 US CPI inflation, compared against Stock and Watson (2007).
- Shiller’s log-CAPE ratio, compared against Campbell and Shiller (1998).
- The US–Canada 10-year yield differential, compared against the naive iid Welch baseline.
All three layers reproduce all three references with agreement in every case. But the width of the agreement tells the real story. The interval widths scale monotonically with the persistence of the underlying series. At moderate persistence (φ ≈ 0.45, the inflation series), the Bayesian interval is actually narrower than HAR — 0.81 times its width. At high persistence (φ ≈ 0.97, the CAPE series), the Bayesian interval is 2.8 times wider. At near-unit-root persistence (φ ≈ 0.99, the yield differential), it is 15 times wider.
This gradient is the framework’s central empirical finding. Both layers are technically asymptotically valid. Only the Bayesian layer accounts honestly for the finite-sample uncertainty inflation that occurs as φ approaches 1. The HAR and bootstrap intervals do not widen because they know more — they fail to widen because their asymptotic critical values have not yet caught up with the data.
When to use it — and when not to
HTDV is the right tool when your data are time-dependent or spatially dependent, when your samples are of unequal size, when you suspect heavy tails but cannot rule them out, and when you need an inferential answer (a test or an interval) rather than a prediction. It is particularly valuable when the stakes are high enough that you want your conclusion to survive methodological scrutiny — the framework ships its own validation evidence precisely so that a reviewer can interrogate the calibration claims rather than taking them on faith.
It is the wrong tool when your data are genuinely independent with finite variance — classical methods are simpler, equivalent, and faster. It is also not designed for long-memory processes, explicit unit-root testing, structural breaks (unless you segment the sample first), or forecasting. The framework is built for hypothesis testing and parameter estimation under uncertainty, not for predictive accuracy.
An open architecture
The package exposes its full infrastructure: the simulation engine (htdv_simstudy()), the equivalence constants calculator, the diagnostic suite, the posterior-predictive checks on dependence statistics, and the decision tools — ROPE-based decisions (Kruschke, 2018), bridge-sampling Bayes factors, WAIC and leave-future-out cross-validation, and predictive stacking (Yao, Vehtari, Simpson, and Gelman, 2018). Every function is documented with its underlying reference, so the user can trace any method back to its source.
The complete function reference, mathematical foundations, tutorial walkthroughs (oriented toward novices, applied statisticians, and mathematicians respectively), and the full validation narrative are in the HTDV Wiki on GitHub. The package is installed with a single command — remotes::install_github("IsadoreNabi/HTDV") — and requires rstan as its only hard dependency.
The larger point
HTDV embodies a methodological philosophy worth stating explicitly: when no single inferential method is universally valid in the finite-sample regime, the honest response is not to pick the best one and hide its limitations, but to run several and make the disagreement visible. The framework’s value is not that it always gives you a narrower interval or a more powerful test. Its value is that it shows you — concretely, quantitatively — where your inference is on solid ground and where it is standing on asymptotic ice.
The validation evidence makes this concrete. In 98% of the simulation cells, the Bayesian layer alone passes the calibration benchmarks. The HAR and bootstrap layers pass in the regime where asymptotics have bitten — low persistence, large samples — and fail predictably outside it. The framework does not hide that failure. It turns it into a signal.
That signal is the product.
HTDV is released under the MIT license. The companion paper, full validation vignette, and reproducibility scripts are available at github.com/IsadoreNabi/HTDV. For the complete mathematical foundations, function reference, and tutorials, see the project wiki.
Leave a Comment/Deja un Comentario