Sectorial Exclusion Criteria in the Marxist Analysis of the Average Rate of Profit: The United States Case (1960-2020)

LINK TO ARTICLE (ENLACE AL ARTÍCULO):https://doi.org/10.31219/osf.io/seqbf

Aquí tienes el texto completo y actualizado, con las versiones en inglés y español listas para copiar y pegar en WordPress. He incorporado todos los cambios metodológicos y los hallazgos críticos (Horseshoe, DFM, PCA y HP-GC) que discutimos.


PROBLEM STATEMENT AND OBJECTIVES

The article addresses the lack of a theoretically grounded criterion for determining which economic activities should be included or excluded when estimating the long-term Marxist average rate of profit (ARoP). The main objective is to provide a standard Marxist decision criterion for the inclusion and exclusion of economic activities in the calculation of the ARoP, applied to the case of U.S. economic sectors between 1960 and 2020.

THEORETICAL FRAMEWORK

The study is based on Marxist theory, specifically on the Marxist definition of productive labor, its location in the circuit of capital, and its relationship with the production of surplus value. Emphasis is placed on the distinction between productive and unproductive labor, as well as the difference between productive and unproductive consumption.

METHODS AND TECHNIQUES

The study uses a variety of advanced econometric and time series analysis techniques:

  • Daubechies wavelet transform filters with increased symmetry.
  • Empirical Mode Decomposition (EMD).
  • Hodrick-Prescott filter embedded in an unobserved components model (HP-GC).
  • Various unit root tests.
  • Principal Component Analysis (PCA) via Singular Value Decomposition (SVD) with Heavy-tailed Distribution Analysis (Gamma/Weibull) and Information Theory (Entropy).
  • Regularized Horseshoe Regression (RHR) for variable selection in high-multicollinearity environments.
  • Dynamic Factor Models (DFM) for structural validation and latent signal detection.

RESULTS

  • Criteria were established for the inclusion and exclusion of economic sectors in the calculation of the Marxist ARoP.
  • The application of these criteria to the U.S. economy resulted in the exclusion of sectors such as wholesale and retail trade, finance and insurance, real estate, and government.
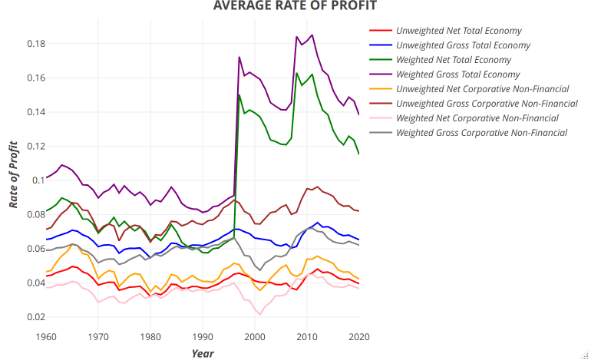
  • The ARoP calculated with the sectors included according to the established criteria showed a long-term decreasing trend, consistent with Marxist theory.
  • Econometric analyses revealed a structural duality: while Regularized Horseshoe Regression identified a productive causal core aligned with value theory, DFM and PCA showed that the macroscopic phenomenological dynamics are dominated by rentier (Real Estate) and government sectors. However, the declining trend of the Rate of Profit manifests in both nuclei.
  • PCA analysis demonstrated that qualitative systemic variance (Gamma/Weibull distributions) is driven by a small subset of sectors (Top 10-15%), while the bulk of the economy (PC1) represents inertial noise or ‘Brownian motion’.

CONCLUSIONS

  • The proposed criteria for the inclusion and exclusion of sectors in the calculation of the Marxist ARoP are gnoseologically and econometrically valid for the case of the U.S. economy between 1960 and 2020.
  • The study satisfies the Coherence Theory of Truth, as the new proposition (Marxist criteria) harmonizes logically with theory and statistically with complex objective evidence.
  • The criteria demonstrated objective consistency regarding which sectors are structurally relevant, distinguishing between the productive essence (identified by Horseshoe) and the rentier appearance (identified by DFM).
  • The long-term decreasing trend of the ARoP was confirmed by non-parametric filters (EMD, Wavelets); exceptions of flat trends observed with the HP-GC filter in rentier series were identified as artifacts of the filter’s rigidity regarding asset price inertia, rather than signs of economic health.
  • The study provides a solid methodological basis for future research on the ARoP and the dynamics of capitalism from a Marxist perspective.

PLANTEAMIENTO DEL PROBLEMA Y OBJETIVOS

El artículo aborda la falta de un criterio teóricamente fundamentado para determinar qué actividades económicas deben incluirse o excluirse al estimar la tasa media de ganancia (TMG) marxista a largo plazo. El objetivo principal es proporcionar un criterio de decisión estándar marxista para la inclusión y exclusión de actividades económicas en el cálculo de la TMG, aplicado al caso de los sectores económicos de Estados Unidos entre 1960 y 2020.

MARCO TEÓRICO

El estudio se basa en la teoría marxista, específicamente en la definición marxista de trabajo productivo, su ubicación en el circuito del capital y su relación con la producción de plusvalía. Se hace hincapié en la distinción entre trabajo productivo e improductivo, así como en la diferencia entre consumo productivo e improductivo.

MÉTODOS Y TÉCNICAS

El estudio utiliza una variedad de técnicas econométricas y de análisis de series temporales avanzadas:

  • Filtros de transformada wavelet de Daubechies con simetría aumentada.
  • Descomposición en Modos Empíricos (EMD).
  • Filtro Hodrick-Prescott incrustado en un modelo de componentes no observables (HP-GC).
  • Diversas pruebas de raíz unitaria.
  • Análisis de Componentes Principales (ACP) vía Descomposición en Valores Singulares (DVS) con Análisis de Distribuciones de Cola Pesada (Gamma/Weibull) y Teoría de la Información (Entropía).
  • Regresión Horseshoe Regularizada (RHR) para selección de variables en entornos de alta multicolinealidad.
  • Modelos de Factores Dinámicos (DFM) para validación estructural y detección de señales latentes.

RESULTADOS

  • Se establecieron criterios para la inclusión y exclusión de sectores económicos en el cálculo de la TMG marxista.
  • La aplicación de estos criterios a la economía estadounidense resultó en la exclusión de sectores como el comercio mayorista y minorista, finanzas y seguros, bienes raíces, y el gobierno.
  • La TMG calculada con los sectores incluidos según los criterios establecidos mostró una tendencia decreciente a largo plazo, consistente con la teoría marxista.
  • Los análisis econométricos revelaron una dualidad estructural: mientras la Regresión Horseshoe identificó un núcleo causal productivo alineado con la teoría del valor, el DFM y el ACP evidenciaron que la dinámica macroscópica fenomenológica está dominada por sectores rentistas (Bienes Raíces) y gubernamentales. Sin embargo, la tendencia decreciente de la Tasa de Ganancia se manifiesta en ambos núcleos.
  • El análisis de ACP demostró que la varianza sistémica cualitativa (distribuciones Gamma/Weibull) es impulsada por un pequeño subconjunto de sectores (Top 10-15%), mientras que el grueso de la economía (PC1) representa ruido inercial o ‘movimiento browniano’.

CONCLUSIONES

  • Los criterios propuestos para la inclusión y exclusión de sectores en el cálculo de la TMG marxista son válidos gnoseológica y econométricamente para el caso de la economía estadounidense entre 1960 y 2020.
  • La investigación satisface la Teoría de la Coherencia de la Verdad, ya que la nueva proposición (criterios marxistas) armoniza lógicamente con la teoría y estadísticamente con la evidencia objetiva compleja.
  • Los criterios demostraron consistencia objetiva, distinguiendo entre la esencia productiva (identificada por Horseshoe) y la apariencia rentista (identificada por DFM) en la dinámica económica capitalista.
  • Se confirmó la tendencia decreciente a largo plazo de la TMG mediante filtros no paramétricos (EMD, Wavelets); las excepciones de tendencia plana observadas con el filtro HP-GC en series rentistas se identificaron como artefactos de la rigidez del filtro ante la inercia de precios de activos, y no como signos de salud económica.
  • El estudio proporciona una base metodológica sólida para futuras investigaciones sobre la TMG y la dinámica del capitalismo desde una perspectiva marxista.

UN CASO DE ESTUDIO SOBRE LAS APLICACIONES DE LOS MODELOS DE REGRESIÓN LINEAL: ANÁLISIS DE TRATAMIENTOS PARA POTABILIZACIÓN DEL AGUA MEDIANTE MODELOS LINEALES GENERALIZADOS, PARTE I

isadore nabi

REFERENCIAS

Abril Díaz, N., Bárcena Ruiz, A., Fernández Reyes, E., Galván Cejudo, A., Jorrín Novo, J., Peinado Peinado, J., . . . Túñez Fiñana, I. (6 de Julio de 2021). Espectrofometría: Espectros de absorción y cuantificación colorimétrica de biomoléculas. Obtenido de Departamento de Bioquímica y Biología Molecular, Universidad de Córdoba: https://www.uco.es/dptos/bioquimica-biol-mol/pdfs/08_ESPECTROFOTOMETRIA.pdf

Asociación Española de Fabricantes de Agronutrientes. (26 de Enero de 2021). Clasificación del pH. Obtenido de Glosario de términos útiles en Agronutrición: https://aefa-agronutrientes.org/glosario-de-terminos-utiles-en-agronutricion/clasificacion-del-ph

Atil Husni, I., Nyoman Budiantara, I., & Zain, I. (2018). Partial hypothesis testing of truncated spline model in nonparametric regression. College Park, Maryland: American Institute of Physics Conference Proceedings. Obtenido de https://aip.scitation.org/doi/pdf/10.1063/1.5062798

Bermúdez Cabrera, X., Fleites Ramírez, M., & Contreras Moya, A. M. (Septiembre-diciembre de 2009). ESTUDIO DEL PROCESO DE COAGULACIÓN-FLOCULACIÓN DE AGUAS RESIDUALES DE LA EMPRESA TEXTIL “DESEMBARCO DEL GRANMA” A ESCALA DE LABORATORIO. Revista de Tecnología Química, XXIX(3), 64-73. Obtenido de https://www.redalyc.org/pdf/4455/445543760009.pdf

Cepeda, Z., & Cepeda C., E. (2005). Application of Generalized Linear Models to Data Analysis in Drinking Water Treatment. Revista Colombiana de Estad ́ıstica, XXVIII(2), 233-242.

Domènech, X., & Peral, J. (2006). Química Ambiental de sistemas terrestres. (S. REVERTÉ, Ed.) Barcelona.

Li, M., Duan, N., Zhang, D., Li, C.-H., & Ming, Z. (2009). Collaborative Decoding: Partial Hypothesis Re-ranking Using Translation Consensus between Decoders. Suntec, Singapore: Proceedings of the Joint Conference of the 47th Annual Meeting of the ACL and the 4th International Joint Conference on Natural Language Processing of the AFNLP. Obtenido de https://aclanthology.org/P09-1066.pdf

Nabi, I. (27 de Agosto de 2021). Modelos Lineales Generalizados. Obtenido de El Blog de Isadore Nabi: https://marxistphilosophyofscience.com/wp-content/uploads/2021/08/modelos-lineales-generalizados-isadore-nabi.pdf

Nabi, I. (21 de Septiembre de 2021). Supuestos del Modelo Clásico de Regresión Lineal y de los Modelos Lineales Generalizados. Obtenido de El Blog de Isadore Nabi: https://marxianstatistics.com/2021/09/24/supuestos-del-modelo-clasico-de-regresion-lineal-y-de-los-modelos-lineales-generalizados/

Organización Mundial de la Salud. (Mayo de 2009). Tratamiento de emergencia del agua potable en el lugar de consumo. Obtenido de http://bvsper.paho.org/share/ETRAS/AyS/texcom/desastres/opsguia5.pdf

Pérez de la Cruz, F. J., & Urrea Mallebrera, M. A. (21 de Enero de 2021). ABASTECIMIENTO DE AGUAS. Coagulación y floculación. Obtenido de Universidad Politécnica de Cartagena: https://ocw.bib.upct.es/pluginfile.php/6019/mod_resource/content/1/Tema_06_COAGULACION_Y_FLOCULACION.pdf

Rahim, F., Budiantara, N., & Permatasari, E. O. (Marzo de 2019). Spline Truncated Nonparametric Regression Modeling for Maternal Mortality Rate in East Java. Jurnal Penelitian Sosial Keagamaan, II(1), 39-44. Obtenido de https://media.neliti.com/media/publications/323488-spline-truncated-nonparametric-regressio-fae11742.pdf

SUPUESTOS DEL MODELO CLÁSICO DE REGRESIÓN LINEAL Y DE LOS MODELOS LINEALES GENERALIZADOS

isadore nabi

REFERENCIAS

Banerjee, A. (29 de Octubre de 2019). Intuition behind model fitting: Overfitting v/s Underfitting. Obtenido de Towards Data Science: https://towardsdatascience.com/intuition-behind-model-fitting-overfitting-v-s-underfitting-d308c21655c7

Bhuptani, R. (13 de Julio de 2020). Quora. Obtenido de What is the difference between linear regression and least squares?: https://www.quora.com/What-is-the-difference-between-linear-regression-and-least-squares

Cross Validated. (23 de Marzo de 2018). Will log transformation always mitigate heteroskedasticity? Obtenido de StackExchange: https://stats.stackexchange.com/questions/336315/will-log-transformation-always-mitigate-heteroskedasticity

Greene, W. (2012). Econometric Analysis (Séptima ed.). Harlow, Essex, England: Pearson Education Limited.

Guanga, A. (11 de Octubre de 2018). Machine Learning: Bias VS. Variance. Obtenido de Becoming Human: Artificial Intelligence Magazine: https://becominghuman.ai/machine-learning-bias-vs-variance-641f924e6c57

Gujarati, D., & Porter, D. (8 de Julio de 2010). Econometría (Quinta ed.). México, D.F.: McGrawHill Educación. Obtenido de Homocedasticidad.

McCullagh, P., & Nelder, J. A. (1989). Generalized Linear Models (Segunda ed.). London: Chapman and Hall.

MIT Computer Science & Artificial Intelligence Lab. (6 de Mayo de 2021). Solving over- and under-determined sets of equations. Obtenido de Articles: http://people.csail.mit.edu/bkph/articles/Pseudo_Inverse.pdf

Nabi, I. (27 de Agosto de 2021). MODELOS LINEALES GENERALIZADOS. Obtenido de El Blog de Isadore Nabi: https://marxistphilosophyofscience.com/wp-content/uploads/2021/08/modelos-lineales-generalizados-isadore-nabi.pdf

Penn State University, Eberly College of Science. (2018). 10.4 – Multicollinearity. Obtenido de Lesson 10: Regression Pitfalls: https://online.stat.psu.edu/stat462/node/177/

Penn State University, Eberly College of Science. (24 de Mayo de 2021). Introduction to Generalized Linear Models. Obtenido de Analysis of Discrete Data: https://online.stat.psu.edu/stat504/lesson/6/6.1

Perezgonzalez, J. D. (3 de Marzo de 2015). Fisher, Neyman-Pearson or NHST? A tutorial for teaching data testing. frontiers in PSYCHOLOGY, VI(223), 1-11.

ResearchGate. (10 de Noviembre de 2014). How it can be possible to fit the four-parameter Fedlund model by only 3 PSD points? Obtenido de https://www.researchgate.net/post/How_it_can_be_possible_to_fit_the_four-parameter_Fedlund_model_by_only_3_PSD_points

ResearchGate. (28 de Septiembre de 2019). s there a rule for how many parameters I can fit to a model, depending on the number of data points I use for the fitting? Obtenido de https://www.researchgate.net/post/Is-there-a-rule-for-how-many-parameters-I-can-fit-to-a-model-depending-on-the-number-of-data-points-I-use-for-the-fitting

Salmerón Gómez, R., Blanco Izquierdo, V., & García García, C. (2016). Micronumerosidad aproximada y regresión lineal múltiple. Anales de ASEPUMA(24), 1-17. Obtenido de https://dialnet.unirioja.es/descarga/articulo/6004585.pdf

Simon Fraser University. (30 de Septiembre de 2011). THE CLASSICAL MODEL. Obtenido de http://www.sfu.ca/~dsignori/buec333/lecture%2010.pdf

StackExchange Cross Validated. (2 de Febrero de 2017). “Least Squares” and “Linear Regression”, are they synonyms? Obtenido de What is the difference between least squares and linear regression? Is it the same thing?: https://stats.stackexchange.com/questions/259525/least-squares-and-linear-regression-are-they-synonyms

Wikipedia. (18 de Marzo de 2021). Overdetermined system. Obtenido de Partial Differential Equations: https://en.wikipedia.org/wiki/Overdetermined_system

Zhao, J. (9 de Noviembre de 2017). More features than data points in linear regression? Obtenido de Medium: https://medium.com/@jennifer.zzz/more-features-than-data-points-in-linear-regression-5bcabba6883e

GENERALIDADES DE LA TEORÍA DEL APRENDIZAJE ESTADÍSTICO

ISADORE NABI

VI. Referencias

Barrios, J. (19 de Julio de 2019). La matriz de confusión y sus métricas . Obtenido de Health BIG DATA: https://www.juanbarrios.com/la-matriz-de-confusion-y-sus-metricas/

Google Developers. (19 de Julio de 2021). Clasificación: Exactitud. Obtenido de https://developers.google.com/machine-learning/crash-course/classification/accuracy

Hastie, T., Tibshirani, R., & Friedman, J. (2017). The Elements of Statistical Learning. Data Mining, Inference, and Prediction (Segunda ed.). New York: Springer.

James, G., Witten, D., Hastie, T., & Tibshirani, R. (2013). An Introduction to Statistical Learning with Applications in R. New York: Springer.

StackExchange Data Science. (19 de Junio de 2016). Is GLM a statistical or machine learning model? Obtenido de https://datascience.stackexchange.com/questions/488/is-glm-a-statistical-or-machine-learning-model

StackOverFlow. (15 de Marzo de 2014). Supervised Learning, Unsupervised Learning, Regression. Obtenido de https://stackoverflow.com/questions/22419136/supervised-learning-unsupervised-learning-regression

Wikipedia. (10 de Julio de 2021). Precision and recall. Obtenido de Bioinformatics: https://en.wikipedia.org/wiki/Precision_and_recall

MODELOS LINEALES GENERALIZADOS

isadore nabi

RESUMEN DEL FUNCIONAMIENTO DEL ALGORITMO IRLS

Fuente: https://www.semanticscholar.org/paper/Iterative-and-recursive-least-squares-estimation-Hu/1d19140f9aed669127df0302cdf16a8f3ec04c26

IV. Referencias

Allen, M. (2017). The SAGE Encyclopedia of COMMUNICATION RESEARCH METHODS. London: SAGE Publications, Inc.

AMERICAN PSYCHOLOGICAL ASSOCIATION. (15 de Julio de 2021). level. Obtenido de APA Dictionary of Pyschology: https://dictionary.apa.org/level

AMERICAN PYSCHOLOGICAL ASSOCIATION. (15 de Julio de 2021). factor. Obtenido de APA Dictionary of Pyschology: https://dictionary.apa.org/factor

AMERICAN PYSCHOLOGY ASSOCIATION. (15 de Julio de 2021). logistic regression (LR). Obtenido de APA Dictionary of Pyschology: https://dictionary.apa.org/logistic-regression

Bhuptani, R. (13 de Julio de 2020). Quora. Obtenido de What is the difference between linear regression and least squares?: https://www.quora.com/What-is-the-difference-between-linear-regression-and-least-squares

Burrus, C. S. (7 de Julio de 2021). Iterative Reweighted Least Squares. Obtenido de https://cnx.org/exports/92b90377-2b34-49e4-b26f-7fe572db78a1@12.pdf/iterative-reweighted-least-squares-12.pdf

Centro Centroamericano de Población. (28 de Abril de 2021). Variables y escalas de medición. Obtenido de Universidad de Costa Rica: https://ccp.ucr.ac.cr/cursos/epidistancia/contenido/2_escmed.html

Greene, W. (2012). Econometric Analysis (Séptima ed.). Harlow, Essex, England: Pearson Education Limited.

Gujarati, D., & Porter, D. (8 de Julio de 2010). Econometría (Quinta ed.). México, D.F.: McGrawHill Educación. Obtenido de Homocedasticidad.

Haskett, D. R. (10 de Octubre de 2014). “Mitochondrial DNA and Human Evolution” (1987), by “Mitochondrial DNA and Human Evolution” (1987), by Rebecca Louise Cann, Mark Stoneking, and Allan Charles Wilson. Obtenido de The Embryo Project Encyclopedia: https://embryo.asu.edu/pages/mitochondrial-dna-and-human-evolution-1987-rebecca-louise-cann-mark-stoneking-and-allan

Kolmogórov, A. N., & Fomin, S. V. (1978). Elementos de la Teoría de Funciones y del Análisis Funcional (Tercera ed.). (q. e.-m. Traducido del ruso por Carlos Vega, Trad.) Moscú: MIR.

Lipschutz, S. (1992). Álgebra Lineal. Madrid: McGraw-Hill.

McCullagh, P., & Nelder, J. A. (1989). Generalized Linear Models (Segunda ed.). London: Chapman and Hall.

Nelder, J. A., & Wedderburn, R. W. (1972). Generalized Linear Models. Journal of the Royal Statistical Society, 135(3), 370-384.

Online Stat Book. (15 de Julio de 2021). Levels of an Independent Variable. Obtenido de Independent and dependent variables: https://onlinestatbook.com/2/introduction/variables.html

Patil, G. P., & Shorrock, R. (1965). On Certain Properties of the Exponential-type Families. Journal of the Royal Statistical, 27(1), 94-99.

Perry, J. (2 de Abril de 2014). NORM TO/FROM METRIC. Obtenido de The University of Southern Mississippi: https://www.math.usm.edu/perry/old_classes/mat681sp14/norm_and_metric.pdf

Ritchey, F. (2002). ESTADÍSTICA PARA LAS CIENCIAS SOCIALES. El potencial de la imaginación estadística. México, D.F.: McGRAW-HILL/INTERAMERICANA EDITORES, S.A. DE C.V.

StackExchange Cross Validated. (2 de Febrero de 2017). “Least Squares” and “Linear Regression”, are they synonyms? Obtenido de What is the difference between least squares and linear regression? Is it the same thing?: https://stats.stackexchange.com/questions/259525/least-squares-and-linear-regression-are-they-synonyms

TalkStats. (29 de Noviembre de 2011). SPSS. Obtenido de Forums: http://www.talkstats.com/threads/what-is-the-difference-between-a-factor-and-a-covariate-for-multinomial-logistic-reg.21864/

van den Berg, R. G. (15 de Julio de 2021). Measurement Levels – What and Why? Obtenido de SPSS Tutorials: https://www.spss-tutorials.com/measurement-levels/

Wikipedia. (21 de Mayo de 2021). Iterative proportional fitting. Obtenido de Statistical algorithms: https://en.wikipedia.org/wiki/Iterative_proportional_fitting

Wikipedia. (25 de Febrero de 2021). Iteratively reweighted least squares. Obtenido de Least squares: https://en.wikipedia.org/wiki/Iteratively_reweighted_least_squares

Wikipedia. (8 de Julio de 2021). Lp space. Obtenido de Measure theory: https://www.wikiwand.com/en/Lp_space

MODELO LOGIT O REGRESIÓN LOGÍSTICA

ISADORE NABI

Como se señala en (Aldrich & Nelson, 1984, págs. 30-31), la inferencia estadística comienza por asumir que el modelo que se va a estimar y utilizar para hacer inferencias está correctamente especificado. La presunción, i.e., el supuesto de partida, es que la teoría estadística-matemática correspondiente a tal o cual modelo estadístico es la que justifica el uso del mismo. Sin embargo, a lo planteado por los autores hay que agregar que es aún más importante que las propiedades reales del fenómeno a estudiar (establecidas por el marco científico mediante el cual se estudia) deben corresponderse en una magnitud mínima necesaria y suficiente con las propiedades matemáticas de tal o cual modelo estadístico. Los autores señalan que es bastante fácil demostrar que la especificación incorrecta del modelo tiene implicaciones realmente sustanciales, ya que todas las propiedades estadísticas de las estimaciones pueden destruirse. Para decirlo sin rodeos, la especificación incorrecta del modelo conduce a respuestas incorrectas.

Los autores también elaboran una maravilla gnoseológica en su argumentación, relativa a la justificación del difundido uso del supuesto de linealidad, estableciendo una versión modificada de la navaja de Occam, una que no implica reduccionismo filosófico, como sí lo suele ser la que utilizan, por ejemplo, los bayesianos subjetivos en los modelos parsimoniosos (y fue en ese sentido en el que la criticó también Albert Einstein):

“¿Por qué es tan popular la especificación lineal? Hay dos razones básicas (y relacionadas). En la práctica, los modelos lineales son matemáticamente simples, por lo que los estadísticos han podido aprender mucho sobre ellos, y se han escrito programas de computadora para hacer la estimación. Sobre bases teóricas, la simplicidad conduce a su adopción, justificada por una versión de la navaja de Occam: en ausencia de una guía teórica en sentido contrario, comience asumiendo el caso más simple. Así, la Navaja de Occam, por implicación, diría: Con alguna orientación teórica en sentido contrario, no asuma el caso más simple.” (Aldrich & Nelson, 1984, pág. 31).

La investigación completa se facilita en el siguiente documento: